Ups and Downs of Great Lakes Ice Cover in 2021
Special Stories
6 May 2021 2:00 AM
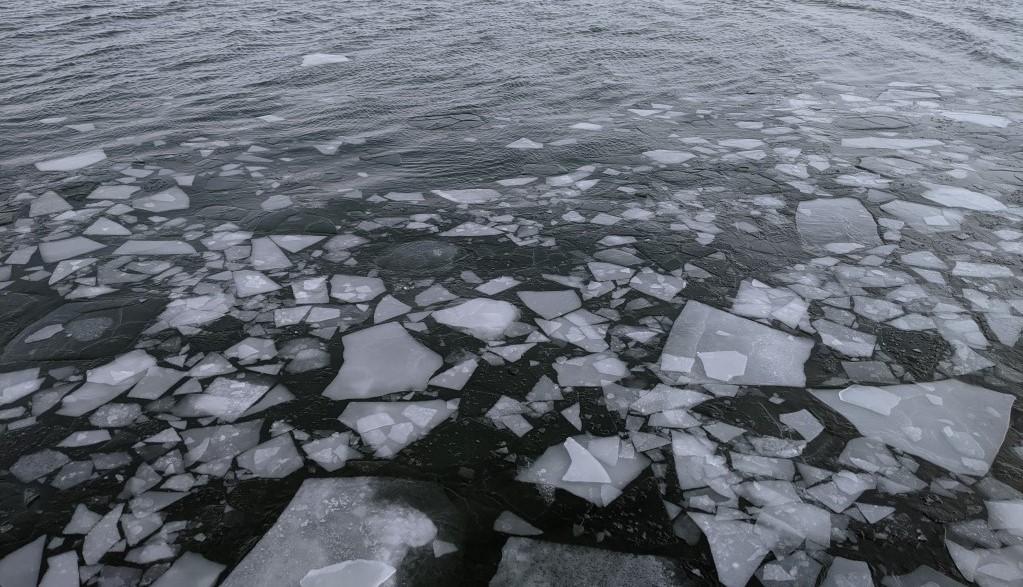
[Flat, jagged pieces of ice float in Lake Huron near Oscoda, MI on February 15, 2021. Credit: G. Farina, NOAA GLERL.]
[Written by NOAA] It’s no secret that the Great Lakes had a wild ride in terms of ice cover this past winter. From a slow start that led to near-record low ice cover in January, to the sudden widespread freeze just a few weeks later, here’s a look back at how ice cover on the lakes has fluctuated during the 2020-2021 ice season.
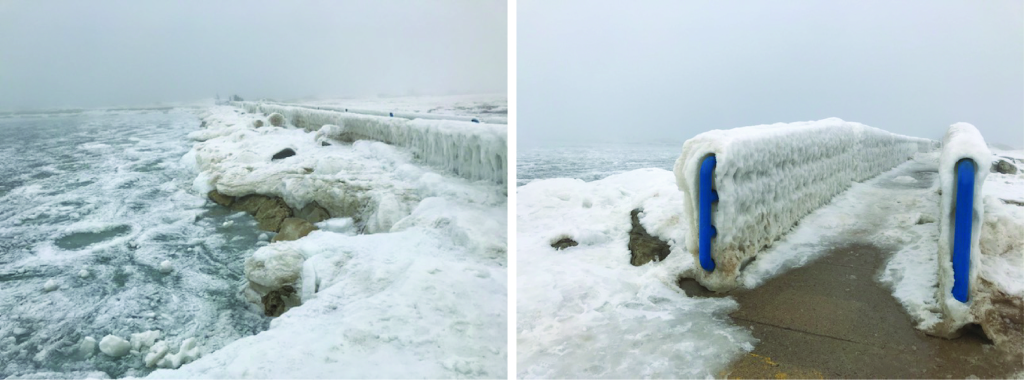 [Ice formations cover a pier on the Lake Michigan shoreline in Holland, MI. February 27, 2021. Credit: Clarice Farina via NOAA GLERL.]
As we highlighted in our last blog post on historic ice data, January 2021 had the second-lowest overall Great Lakes ice cover on record since 1973 (with the very lowest being January 2002). For all five individual lakes, January 2021 was in the top five lowest ice-cover Januarys since 1973.
[Ice formations cover a pier on the Lake Michigan shoreline in Holland, MI. February 27, 2021. Credit: Clarice Farina via NOAA GLERL.]
As we highlighted in our last blog post on historic ice data, January 2021 had the second-lowest overall Great Lakes ice cover on record since 1973 (with the very lowest being January 2002). For all five individual lakes, January 2021 was in the top five lowest ice-cover Januarys since 1973.
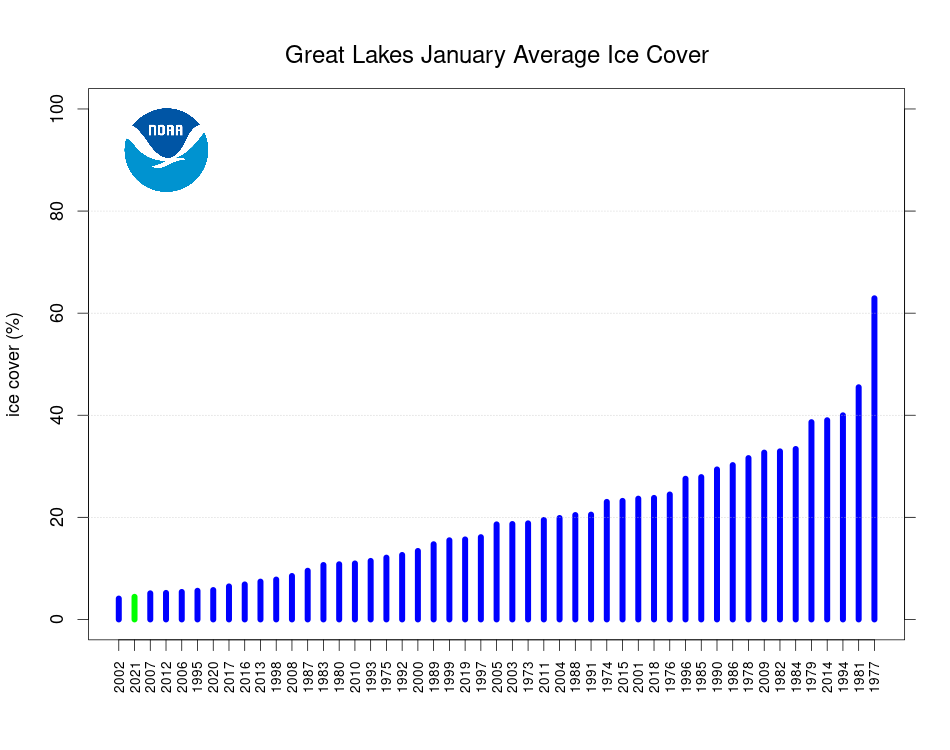 [This graph shows average Great Lakes ice cover for the month of January every year from 1973 to 2021, organized by lowest ice cover (far left) to highest ice cover (far right). Credit: NOAA GLERL.]
Starting out at 10.65% on February 1st, ice cover rose dramatically over the next three weeks with the region’s extreme cold weather. Growing quickly and steadily, total Great Lakes ice cover finally topped out at 45.84% on February 19th. But with air temperatures warming back up shortly afterwards, this spike was short-lived. Within a week it was back down to around 20% and continued to taper off, falling below 1% on April 3rd and reaching 0.1% on April 20.
[This graph shows average Great Lakes ice cover for the month of January every year from 1973 to 2021, organized by lowest ice cover (far left) to highest ice cover (far right). Credit: NOAA GLERL.]
Starting out at 10.65% on February 1st, ice cover rose dramatically over the next three weeks with the region’s extreme cold weather. Growing quickly and steadily, total Great Lakes ice cover finally topped out at 45.84% on February 19th. But with air temperatures warming back up shortly afterwards, this spike was short-lived. Within a week it was back down to around 20% and continued to taper off, falling below 1% on April 3rd and reaching 0.1% on April 20.
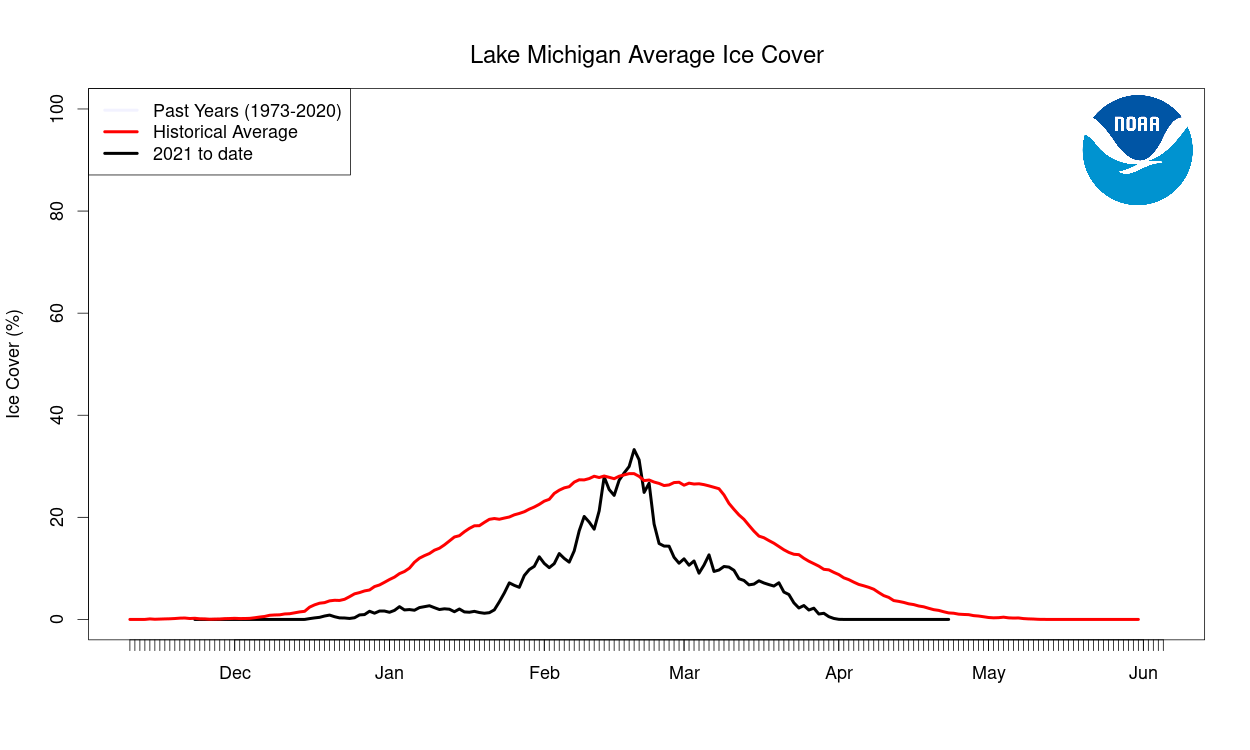
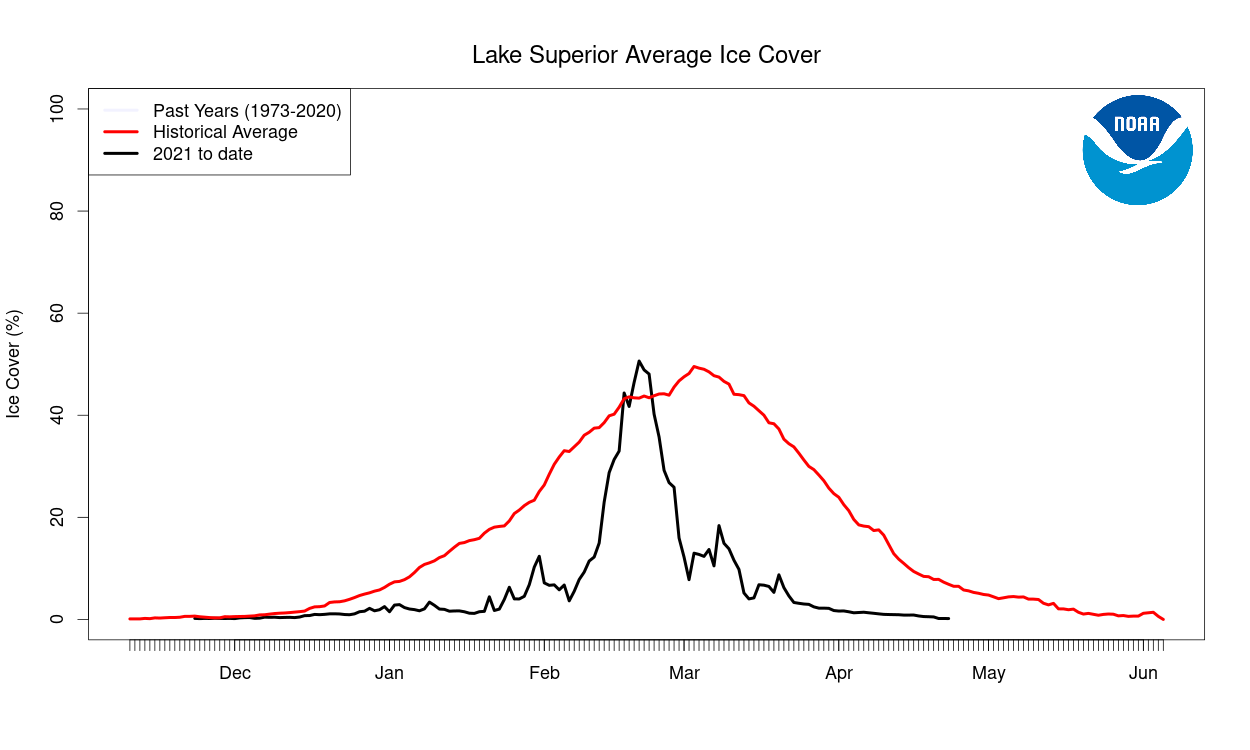
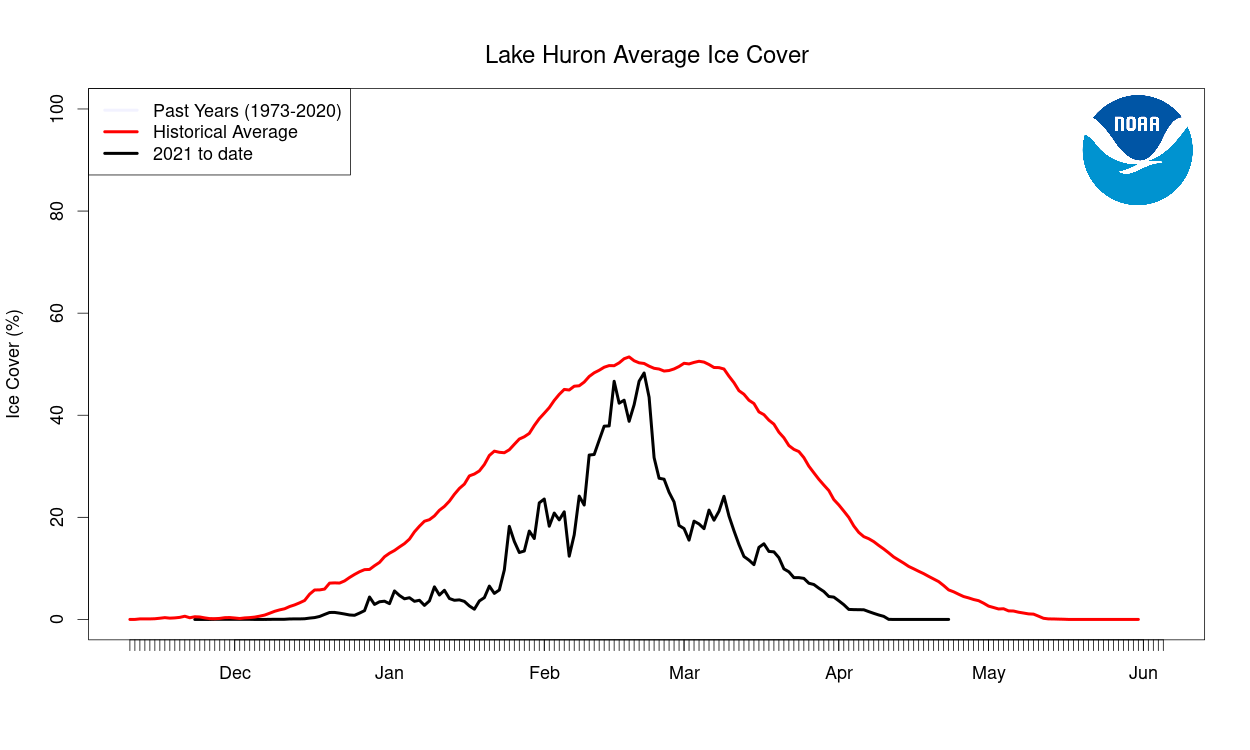
 [This graph shows Great Lakes ice cover in 2021 (black line) compared to the historical average ice cover from 1973-2020 (red line). Credit: NOAA GLERL.]
 Lake Michigan ice cover increased steadily throughout February, with its highest percentage being 33% on February 18th — only briefly staying above its average for that time period. It dropped off quickly the following week, then decreased gradually throughout March.
 Lake Superior spent about a week in mid-February above its average ice cover for those days, peaking at about 51% on February 19th. Similar to Lake Michigan, it only stayed above its average for a short interval before rapidly falling back down under 20%.
 Lake Ontario ice cover took a while to ramp up, staying below 10% until mid-February. It reached maximum ice cover on February 18th, topping out at about 21% – slightly higher than its average for that day.
 Lake Huron was the only lake that did not reach above-average ice cover for the entire winter. Its peak ice cover was 48% on February 20th, which was about the same as its average for that time of year.
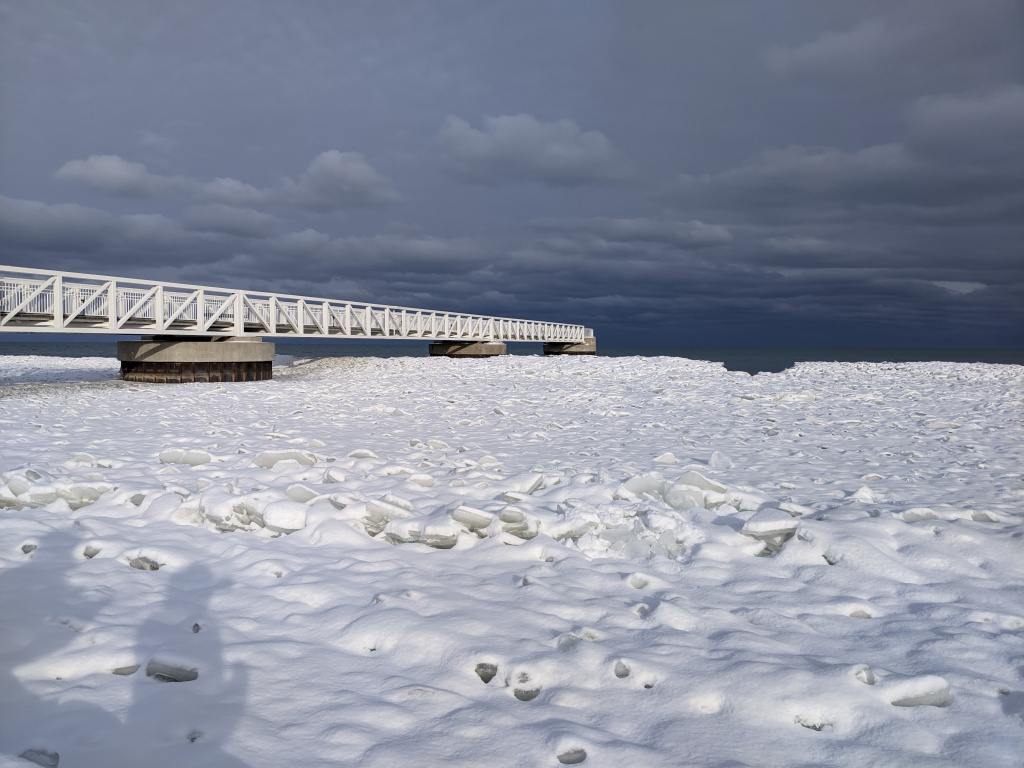 [Ice covers the Lake Huron shoreline in Oscoda, MI on February 15, 2021. Credit: G. Farina, NOAA GLERL.]
This winter’s maximum seasonal ice cover of 45.8% is just 7.5% less than the long-term average of 53.3%. While it’s below the average, it’s still more than double the 2020 seasonal maximum of 19.5% ice cover, but is just over half the 2019 seasonal maximum of 80.9%. With so much year-to-year variability, forecasting ice cover each year can be incredibly difficult. NOAA GLERL’s experimental ice forecast, updated in mid-February, predicted Great Lakes ice cover in 2021 to peak at 38% – not too far off from what it really was. NOAA GLERL continues to analyze both current and historical data to refine the ice forecast model, working to actively improve our experimental Great Lakes ice forecast each year.
[Ice covers the Lake Huron shoreline in Oscoda, MI on February 15, 2021. Credit: G. Farina, NOAA GLERL.]
This winter’s maximum seasonal ice cover of 45.8% is just 7.5% less than the long-term average of 53.3%. While it’s below the average, it’s still more than double the 2020 seasonal maximum of 19.5% ice cover, but is just over half the 2019 seasonal maximum of 80.9%. With so much year-to-year variability, forecasting ice cover each year can be incredibly difficult. NOAA GLERL’s experimental ice forecast, updated in mid-February, predicted Great Lakes ice cover in 2021 to peak at 38% – not too far off from what it really was. NOAA GLERL continues to analyze both current and historical data to refine the ice forecast model, working to actively improve our experimental Great Lakes ice forecast each year.
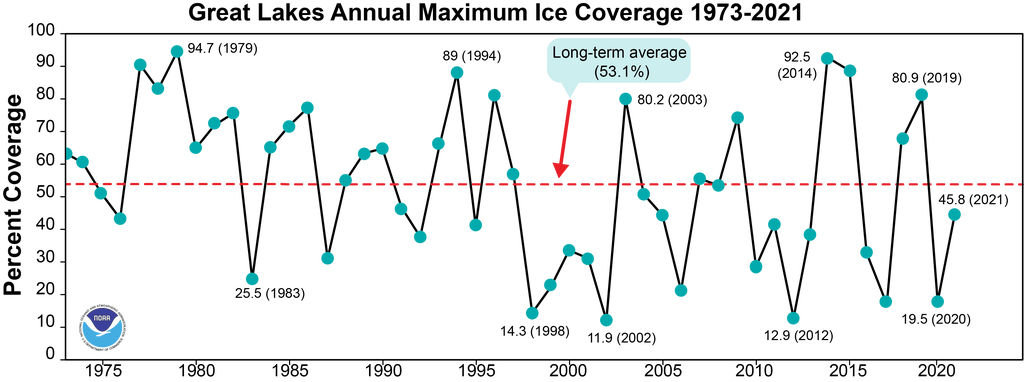 [This graph shows annual maximum ice cover on the Great Lakes each year from 1973 to 2021. Credit: NOAA GLERL.]
For more on NOAA GLERL’s Great Lakes ice cover research and forecasting, visit the ice homepage.
You can access these graphs plus more Great Lakes CoastWatch graphs & data here: https://go.usa.gov/xsRnt
Edited for WeatherNation by Mace Michaels
[This graph shows annual maximum ice cover on the Great Lakes each year from 1973 to 2021. Credit: NOAA GLERL.]
For more on NOAA GLERL’s Great Lakes ice cover research and forecasting, visit the ice homepage.
You can access these graphs plus more Great Lakes CoastWatch graphs & data here: https://go.usa.gov/xsRnt
Edited for WeatherNation by Mace Michaels
[Ice formations cover a pier on the Lake Michigan shoreline in Holland, MI. February 27, 2021. Credit: Clarice Farina via NOAA GLERL.]
As we highlighted in our last blog post on historic ice data, January 2021 had the second-lowest overall Great Lakes ice cover on record since 1973 (with the very lowest being January 2002). For all five individual lakes, January 2021 was in the top five lowest ice-cover Januarys since 1973.
[This graph shows average Great Lakes ice cover for the month of January every year from 1973 to 2021, organized by lowest ice cover (far left) to highest ice cover (far right). Credit: NOAA GLERL.]
Starting out at 10.65% on February 1st, ice cover rose dramatically over the next three weeks with the region’s extreme cold weather. Growing quickly and steadily, total Great Lakes ice cover finally topped out at 45.84% on February 19th. But with air temperatures warming back up shortly afterwards, this spike was short-lived. Within a week it was back down to around 20% and continued to taper off, falling below 1% on April 3rd and reaching 0.1% on April 20.
[This graph shows Great Lakes ice cover in 2021 (black line) compared to the historical average ice cover from 1973-2020 (red line). Credit: NOAA GLERL.]
This Winter vs. The Long-Term Average
While all five lakes were far below their January average, each one did something a little different during February, when compared to its 1973-2020 average. The following graphs show this winter’s ice cover (black line) vs. the 1973-2020 average (red line) for each lake. Lake Erie ice cover jumped dramatically up to 81% in the second week of February, well above its average seasonal peak of around 65%. It stayed above 75% for about two weeks until falling back down below its average at the beginning of March.
Lake Michigan ice cover increased steadily throughout February, with its highest percentage being 33% on February 18th — only briefly staying above its average for that time period. It dropped off quickly the following week, then decreased gradually throughout March.
Lake Superior spent about a week in mid-February above its average ice cover for those days, peaking at about 51% on February 19th. Similar to Lake Michigan, it only stayed above its average for a short interval before rapidly falling back down under 20%.
Lake Ontario ice cover took a while to ramp up, staying below 10% until mid-February. It reached maximum ice cover on February 18th, topping out at about 21% – slightly higher than its average for that day.
Lake Huron was the only lake that did not reach above-average ice cover for the entire winter. Its peak ice cover was 48% on February 20th, which was about the same as its average for that time of year.
Melting into Spring
Throughout March, ice cover on all five lakes continued to decrease steadily, with the exception of a spike in ice cover around the second week of the month likely due to fluctuations in air temperature. For Lakes Erie and Ontario, this short-lived jump was enough to get them back up near their average early March ice cover for a few days. As for the timing of each lake’s peak 2021 ice cover compared with the average, Lakes Erie, Michigan, Huron, and Ontario all peaked later than their average, while Lake Superior is the only one that peaked earlier than its average.
[Ice covers the Lake Huron shoreline in Oscoda, MI on February 15, 2021. Credit: G. Farina, NOAA GLERL.]
This winter’s maximum seasonal ice cover of 45.8% is just 7.5% less than the long-term average of 53.3%. While it’s below the average, it’s still more than double the 2020 seasonal maximum of 19.5% ice cover, but is just over half the 2019 seasonal maximum of 80.9%. With so much year-to-year variability, forecasting ice cover each year can be incredibly difficult. NOAA GLERL’s experimental ice forecast, updated in mid-February, predicted Great Lakes ice cover in 2021 to peak at 38% – not too far off from what it really was. NOAA GLERL continues to analyze both current and historical data to refine the ice forecast model, working to actively improve our experimental Great Lakes ice forecast each year.
[This graph shows annual maximum ice cover on the Great Lakes each year from 1973 to 2021. Credit: NOAA GLERL.]
For more on NOAA GLERL’s Great Lakes ice cover research and forecasting, visit the ice homepage.
You can access these graphs plus more Great Lakes CoastWatch graphs & data here: https://go.usa.gov/xsRnt
Edited for WeatherNation by Mace MichaelsAll Weather News
More
Hurricane Center Monitoring Florida for Tropical Development
Residents and visitors to the Southeast will
30 Jun 2025 10:00 PM

Barry Makes Landfall, Watching Flossie Next
While the Eastern Pacific has made most of th
30 Jun 2025 9:40 PM

Severe Storms For the East Coast Through Tuesday
Frontal systems have been crossing the northe
30 Jun 2025 9:00 PM

Severe Weather Threat Continues in the Midwest
It has been an active, severe season across t
30 Jun 2025 9:00 PM


Where Rain Could Dampen Holiday Travel Plans
AAA is expecting over 70 million travelers to
30 Jun 2025 3:00 PM

Thunderstorms Possible in the Southeast Overnight
SOUTHEAST - Strong thunderstorms have develop
28 Jun 2025 2:40 AM