Winter Outlook 2018-2019: How’d we do?
Special Stories
29 Mar 2019 9:56 AM
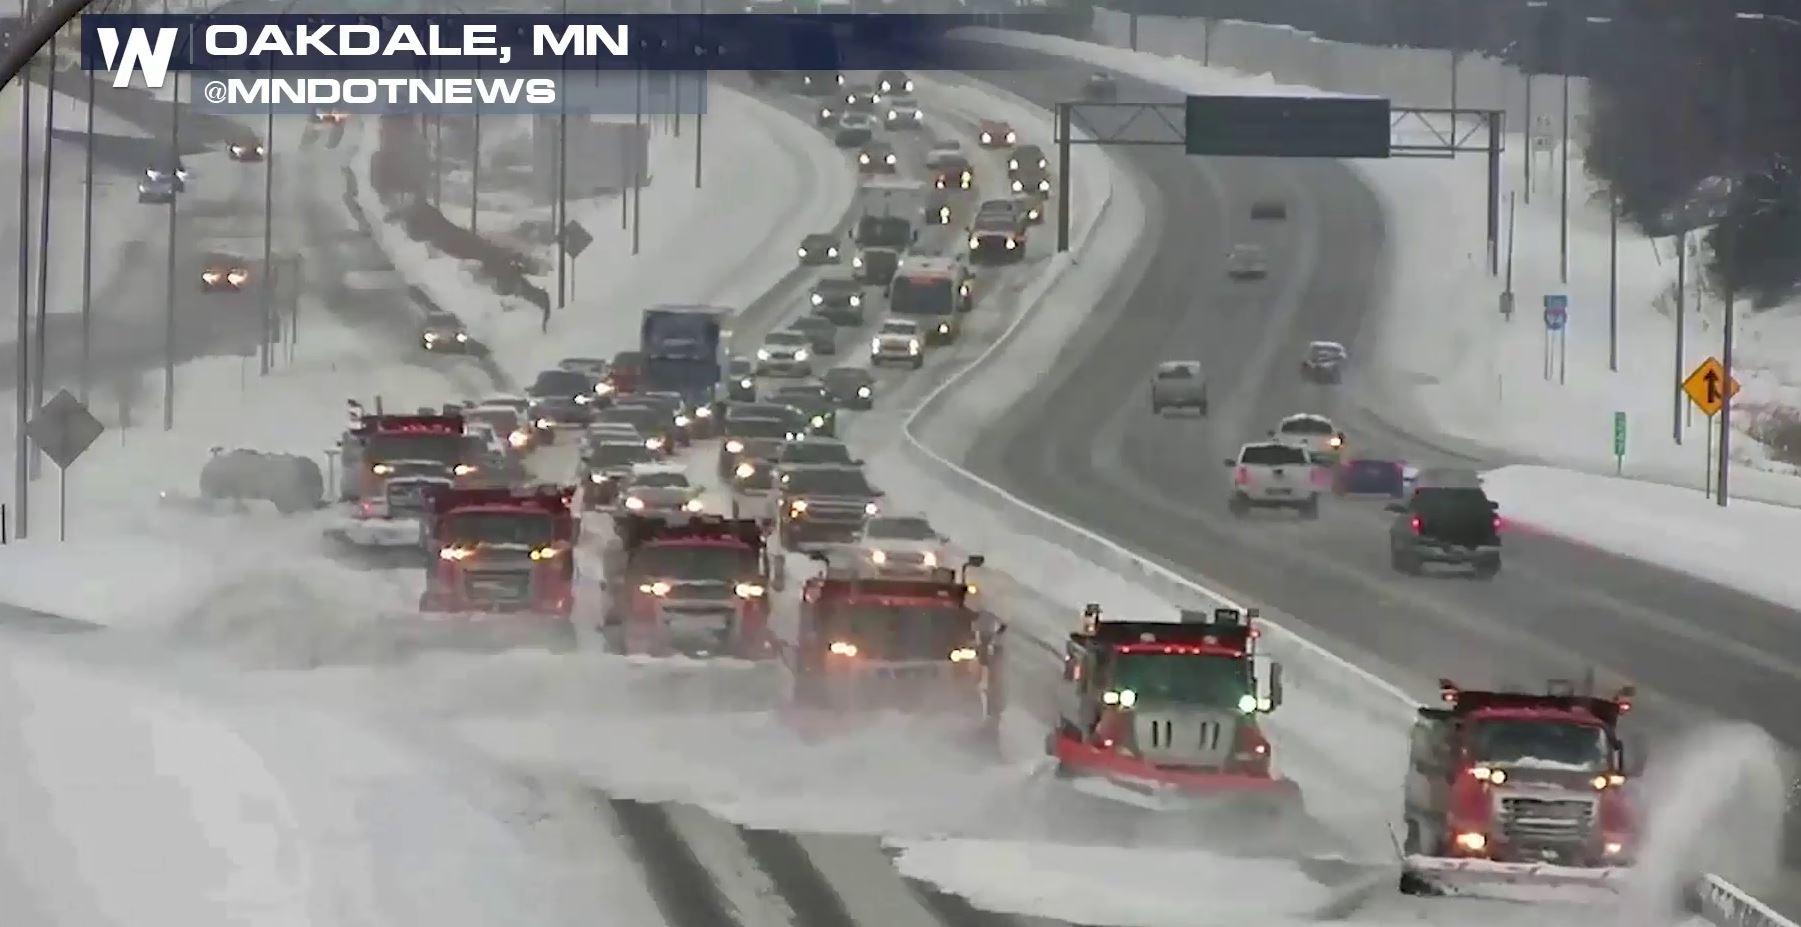
[NOAA by Tom Di Liberto] Winter is over. Some of you may be thinking “About time!” For others, it may be “When did it start?” And for a select few, it’s “Tell that to the snow outside my window.” With the season having ended, it is time for my annual review (see previous reviews here and here) of how NOAA’s Climate Prediction Center’s Winter Outlook did.
This will involve some necessary math, so feel free to brush up via one of the plethora of posts I’ve written previously—located here, here, here, and here—dealing with just how we verify the outlook. As a quick refresher, remember that the underlying basis for seasonal forecasts is that, in the absence of any strong influence to the contrary, the default probability that a given winter’s precipitation or temperature will be well-above, well-below, or near average is 33.3% each. The goal of seasonal forecasts is to figure out if there are any “strong influences to the contrary” that are likely to tip the seasonal outcome away from an even split in the odds.
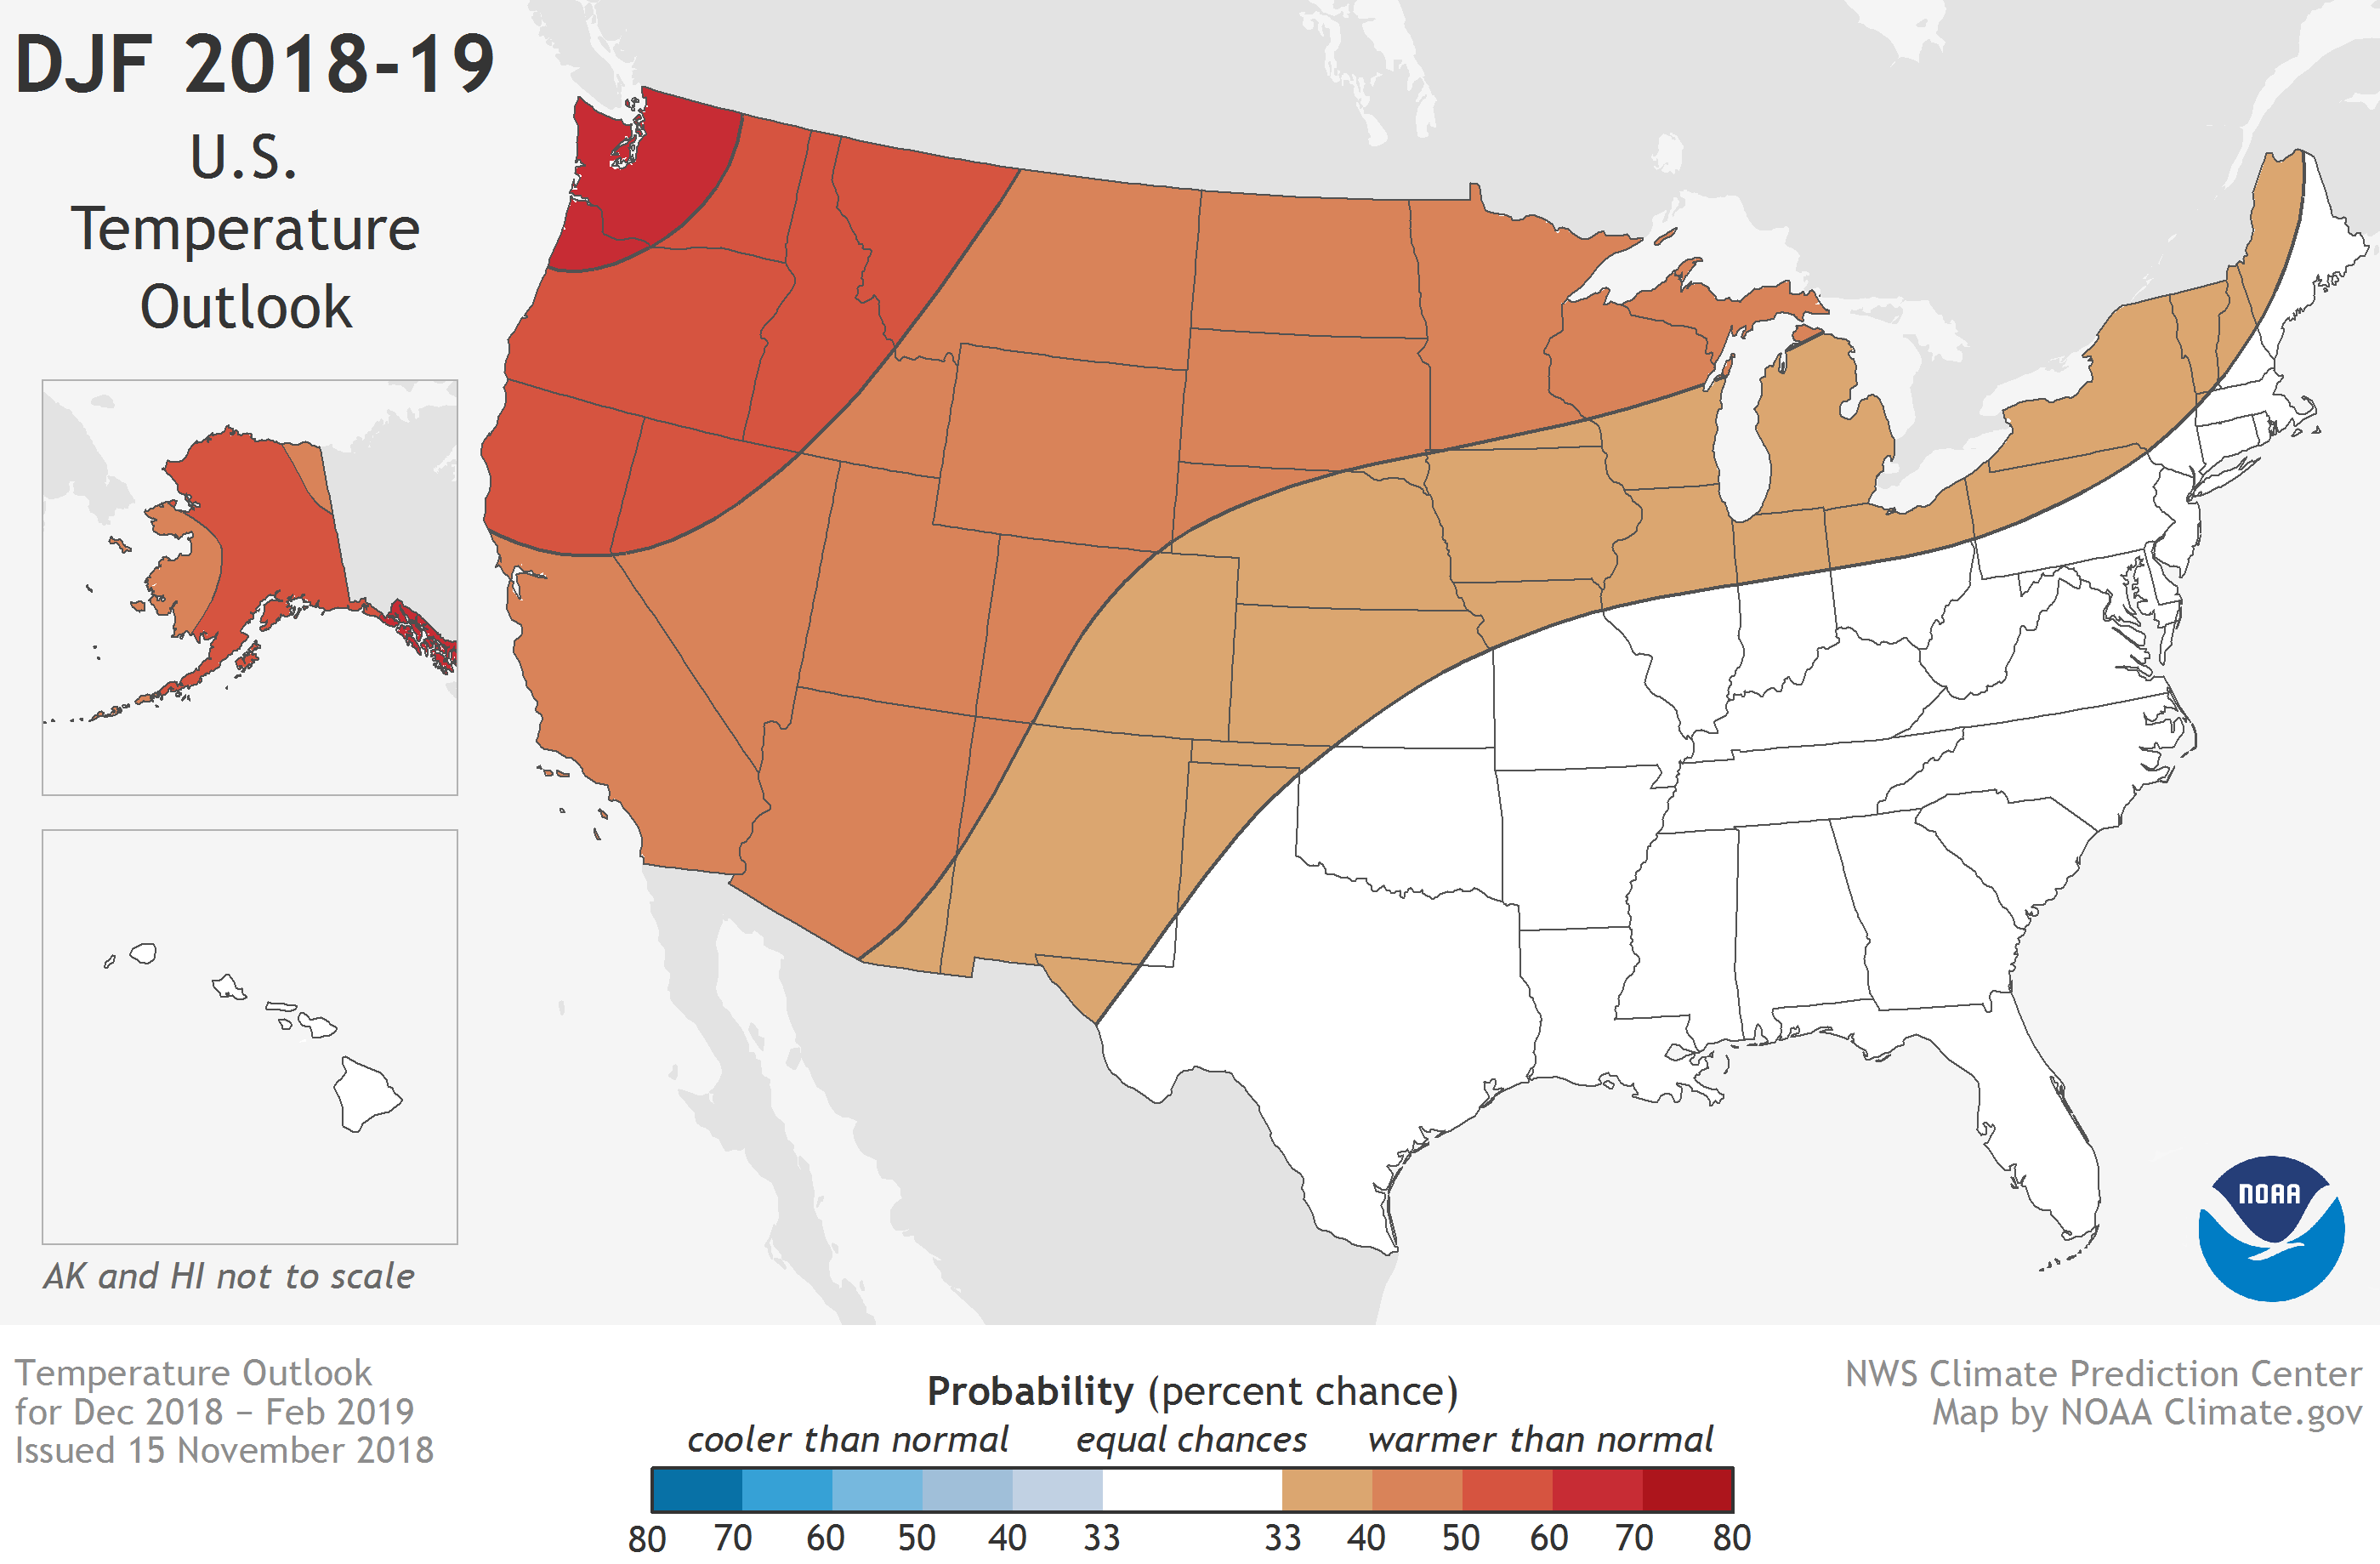 [Winter temperature outlook for December-February 2018-2019, issued on November 15, 2018. The colors denote places where the forecast odds favor a much colder than usual winter (blue colors) or much warmer than usual winter (red), or where the probability of a cold winter, a warm winter, or a near-normal winter are all equal (white). The darker the color, the stronger the chance of that outcome (not the bigger the departure from average). NOAA Climate map, based on data from NOAA CPC.]
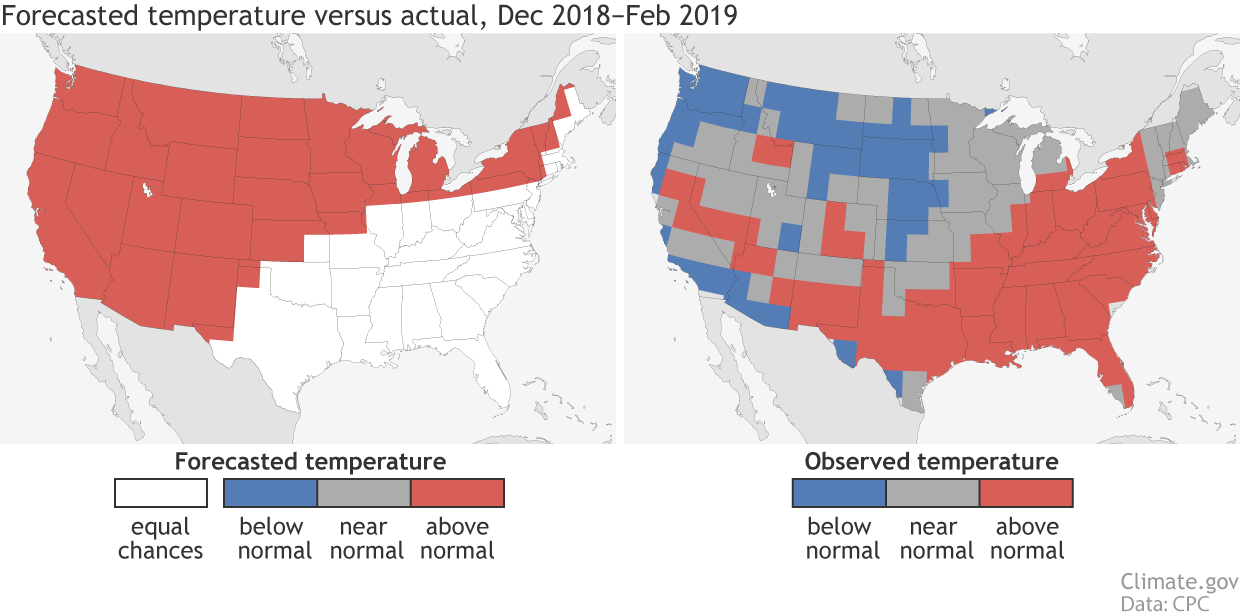 [(left) Temperature forecast for December-February 2018-19, made in mid-November. The colors show the forecast category with the highest probability. White areas are where all three outcomes (warm, cool, or average) were equally likely (each had a 33.3% chance of happening). (right) Observed temperature category for December-February 2018-19. NOAA Climate image based on CPC data.]
To mathematically “see” how the outlook performed, scientists at the CPC use a verification metric known as the Heidke Skill Score (HSS) (2). The Heidke Skill Score is a simple way to see how often the outlook hit or missed and then—because no one is harder on us than we are on ourselves—compares that to how often we would have gotten the right answer just by luck. Any HSS greater than 0 means the outlook was better than random guessing.
Not surprisingly, the HSS for the 2018-2019 Winter Outlook was negative, -13 to be exact for the continental U.S. if we count all forecasts including areas with “equal chance,” and -20 if we only look at areas where forecasters made a choice to favor one outcome over the others (3). This was the lowest seasonal outlook HSS in almost six years (and lowest winter outlook score in 15 years).
Feel free to check out the numbers yourself at one of a number of public websites that the CPC maintains that looks at how their outlooks performed.
[(left) Temperature forecast for December-February 2018-19, made in mid-November. The colors show the forecast category with the highest probability. White areas are where all three outcomes (warm, cool, or average) were equally likely (each had a 33.3% chance of happening). (right) Observed temperature category for December-February 2018-19. NOAA Climate image based on CPC data.]
To mathematically “see” how the outlook performed, scientists at the CPC use a verification metric known as the Heidke Skill Score (HSS) (2). The Heidke Skill Score is a simple way to see how often the outlook hit or missed and then—because no one is harder on us than we are on ourselves—compares that to how often we would have gotten the right answer just by luck. Any HSS greater than 0 means the outlook was better than random guessing.
Not surprisingly, the HSS for the 2018-2019 Winter Outlook was negative, -13 to be exact for the continental U.S. if we count all forecasts including areas with “equal chance,” and -20 if we only look at areas where forecasters made a choice to favor one outcome over the others (3). This was the lowest seasonal outlook HSS in almost six years (and lowest winter outlook score in 15 years).
Feel free to check out the numbers yourself at one of a number of public websites that the CPC maintains that looks at how their outlooks performed.
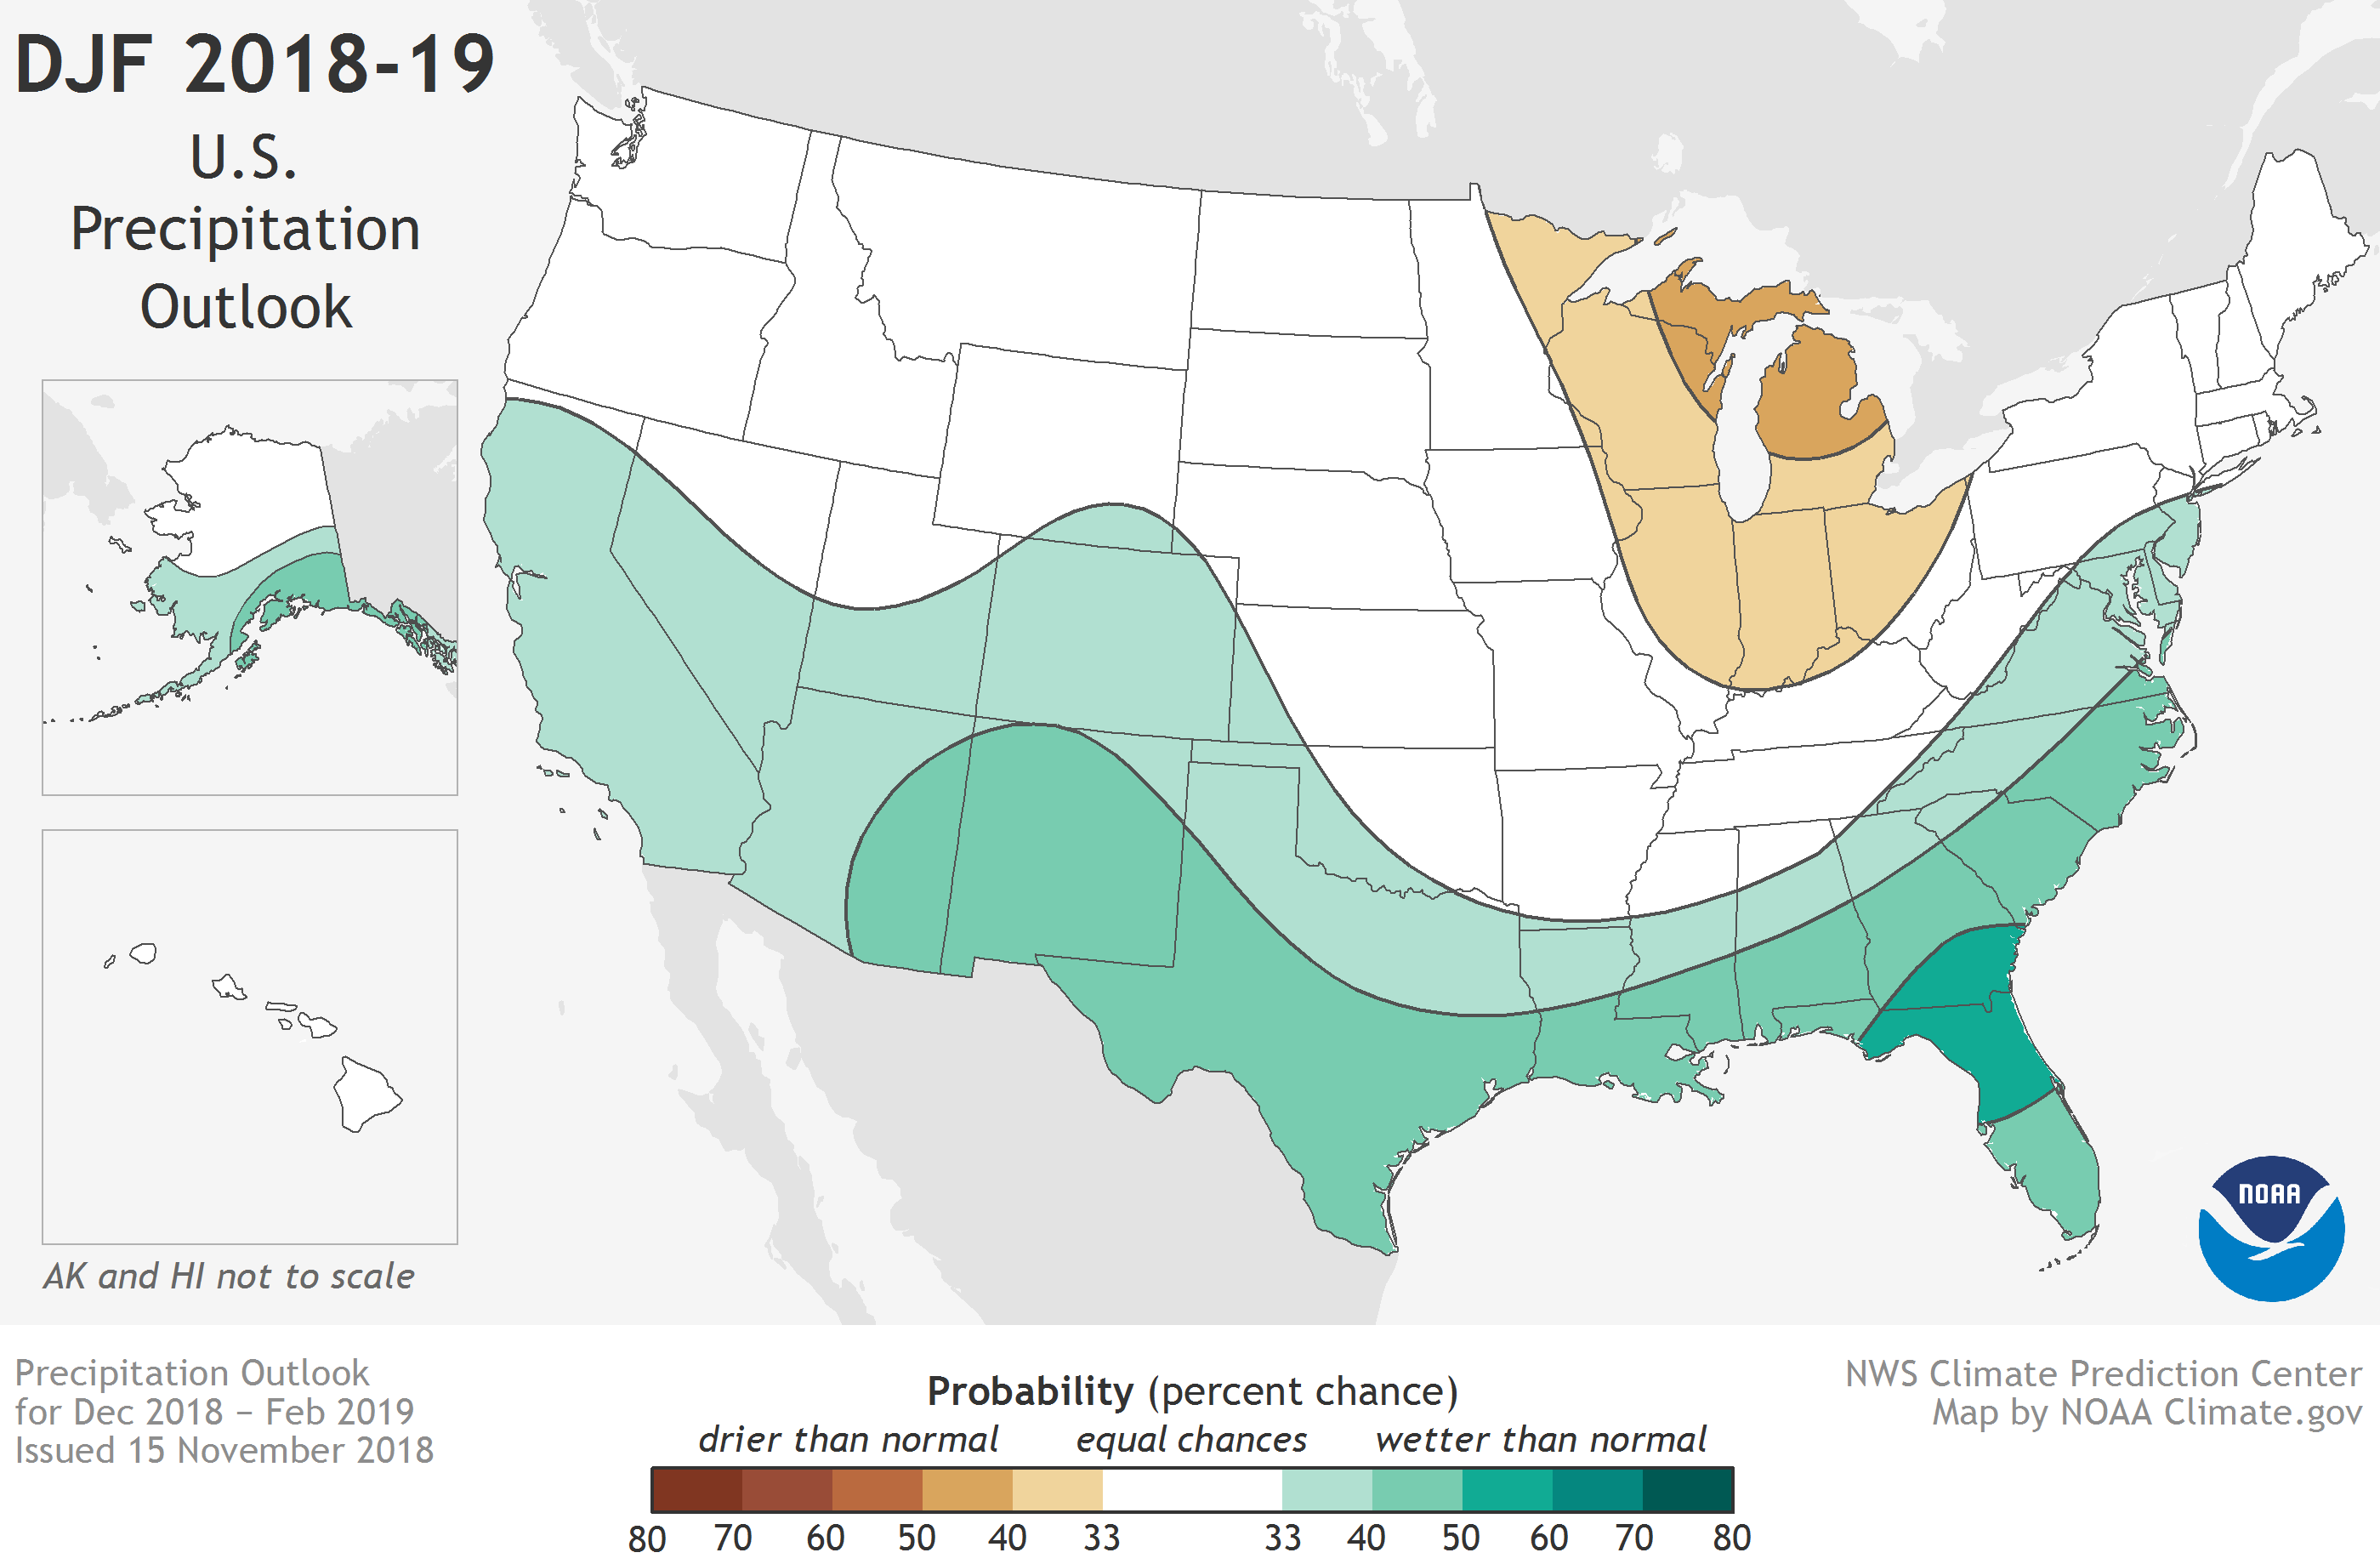 [Winter precipitation outlook for December-February 2018-2019 issued on November 15, 2018. The colors denote places where the forecast odds favor a much drier than usual winter (brown colors) or much wetter than usual winter (blue-green), or where the probability of a dry winter, a wet winter, or a near-normal winter are all equal (white). The darker the color, the stronger the chance of that outcome (not the bigger the departure from average) NOAA Climate map, based on data from NOAA CPC.]
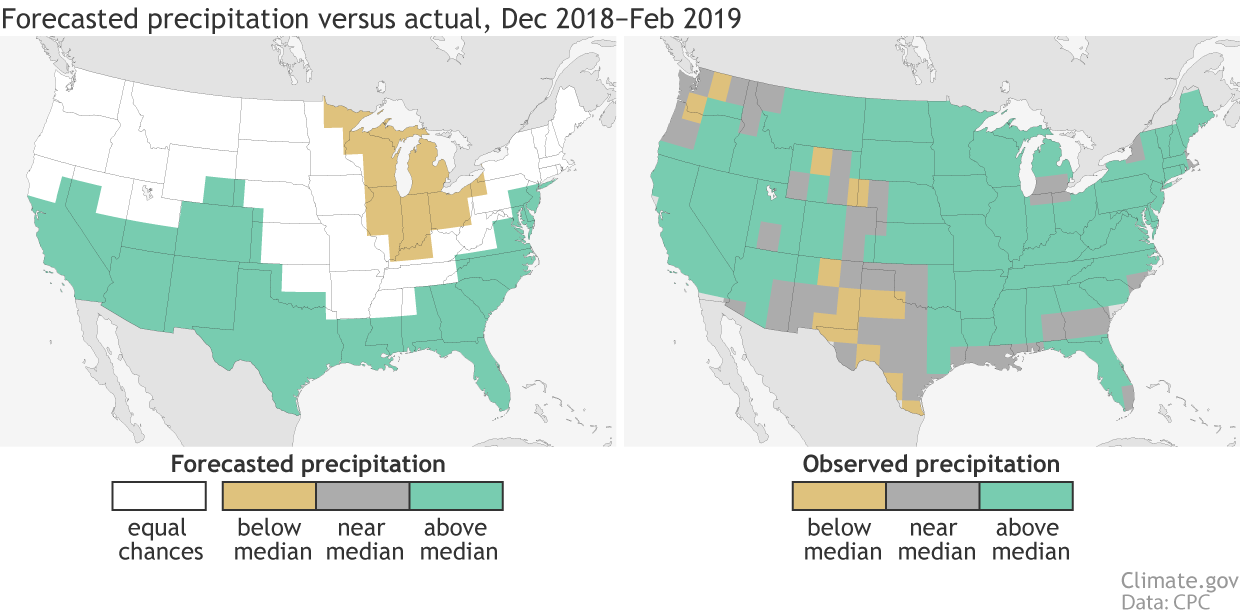 [(left) Precipitation forecast for December-February 2018-19, made in mid-November. The colors show the forecast category with the highest probability. White areas are where all three outcomes (wet, dry, average) were equally likely (each had a 33.3% chance of happening). (right) Observed precipitation category for December-February 2018-19. NOAA Climate image based on CPC data.]
Even with that missed area, the 2018-2019 Winter Outlook had a HSS of 8 for the continental U.S. and 15 when only considering regions where forecasters leaned towards wetter, drier or near-normal. While not an incredibly high score, it was above zero, meaning it was better than random chance. It was in line with the average HSS for all seasonal precipitation outlooks over the last five years, and it was higher than the average score since 1995.
[(left) Precipitation forecast for December-February 2018-19, made in mid-November. The colors show the forecast category with the highest probability. White areas are where all three outcomes (wet, dry, average) were equally likely (each had a 33.3% chance of happening). (right) Observed precipitation category for December-February 2018-19. NOAA Climate image based on CPC data.]
Even with that missed area, the 2018-2019 Winter Outlook had a HSS of 8 for the continental U.S. and 15 when only considering regions where forecasters leaned towards wetter, drier or near-normal. While not an incredibly high score, it was above zero, meaning it was better than random chance. It was in line with the average HSS for all seasonal precipitation outlooks over the last five years, and it was higher than the average score since 1995.
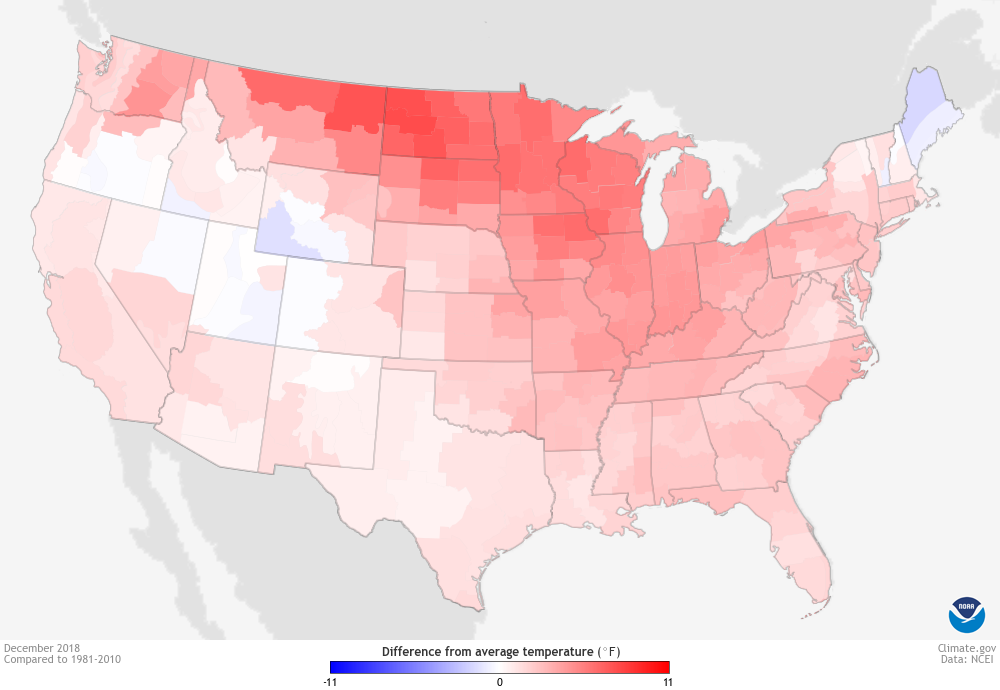 [Differences from average temperature across the continental United States during December 2018. Warmer than average conditions are denoted in red while colder than average conditions are in blue. Warmer than average temperatures were observed coast to coast during December 2018. NOAA Climate image using data from NCEI.]
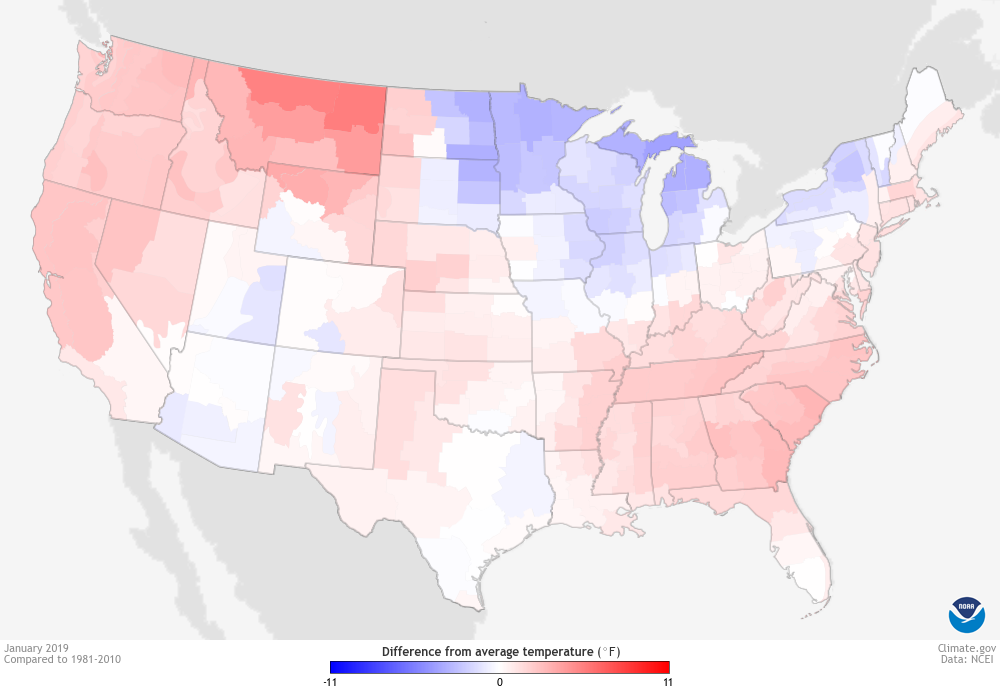 [Differences from average temperature across the continental United States during January 2019. Warmer than average conditions are denoted in red while colder than average conditions are in blue. In January 2019, most of the continental United States observed warmer than average temperatures except for around the Great Lakes. NOAA Climate image using data from NCEI.]
Then, in February, the western half of the country was transported to the ice planet Hoth. A huge area across the Northern Plains stretching into the Pacific Northwest observed temperatures more than 11°F below average for the month. February 2019 became the second-coldest February since 1895 in Montana and North Dakota, the third-coldest in South Dakota, and the fifth-coldest in Washington.
[Differences from average temperature across the continental United States during January 2019. Warmer than average conditions are denoted in red while colder than average conditions are in blue. In January 2019, most of the continental United States observed warmer than average temperatures except for around the Great Lakes. NOAA Climate image using data from NCEI.]
Then, in February, the western half of the country was transported to the ice planet Hoth. A huge area across the Northern Plains stretching into the Pacific Northwest observed temperatures more than 11°F below average for the month. February 2019 became the second-coldest February since 1895 in Montana and North Dakota, the third-coldest in South Dakota, and the fifth-coldest in Washington.
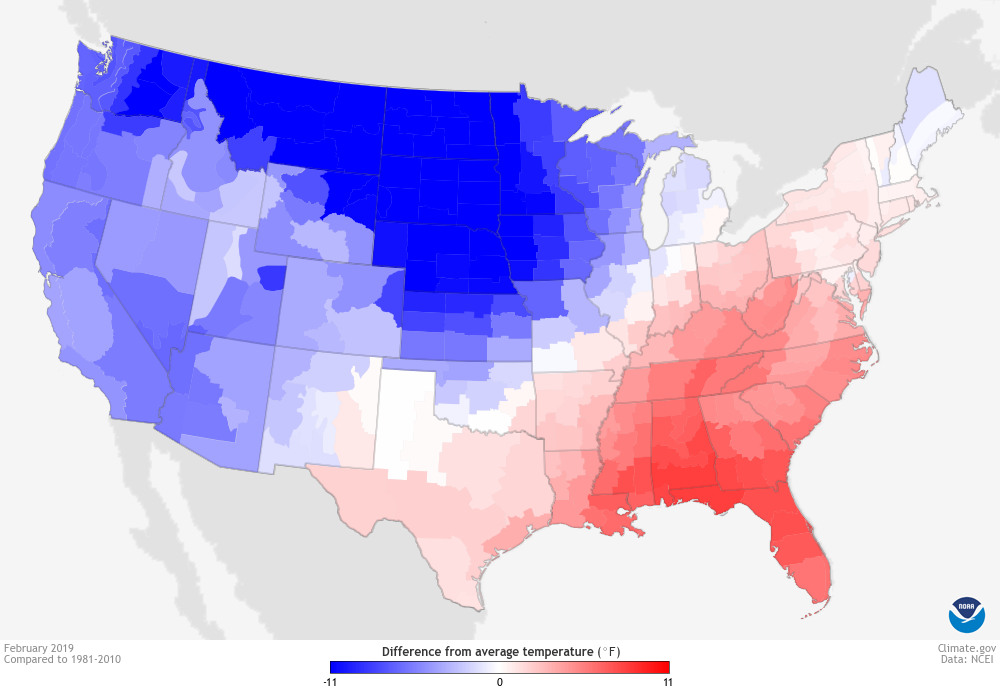 [Differences from average temperature across the continental United States during February 2019. Warmer than average conditions are denoted in red while colder than average conditions are in blue. In February 2019, much colder than average temperatures were recorded across the western and northern United States while the southeastern United States observed warmer than average temperatures. NOAA Climate image using data from NCEI.]
Atmospherically, when one half of the country is so cold, the other half usually experiences the opposite, like how pushing in one side of a balloon makes the opposite side get bigger. So as the central and western United States froze, the Southeast experienced a top-ten-warmest February.
These monthly temperature extremes in February were large enough to change the generally warm, coast-to-coast pattern seen during December and January into the final winter temperature anomaly observed above.
Thus, the winter outlook was looking good for roughly two-thirds of the season; only February’s craziness turned a good outlook into a not so good one.
[Differences from average temperature across the continental United States during February 2019. Warmer than average conditions are denoted in red while colder than average conditions are in blue. In February 2019, much colder than average temperatures were recorded across the western and northern United States while the southeastern United States observed warmer than average temperatures. NOAA Climate image using data from NCEI.]
Atmospherically, when one half of the country is so cold, the other half usually experiences the opposite, like how pushing in one side of a balloon makes the opposite side get bigger. So as the central and western United States froze, the Southeast experienced a top-ten-warmest February.
These monthly temperature extremes in February were large enough to change the generally warm, coast-to-coast pattern seen during December and January into the final winter temperature anomaly observed above.
Thus, the winter outlook was looking good for roughly two-thirds of the season; only February’s craziness turned a good outlook into a not so good one.
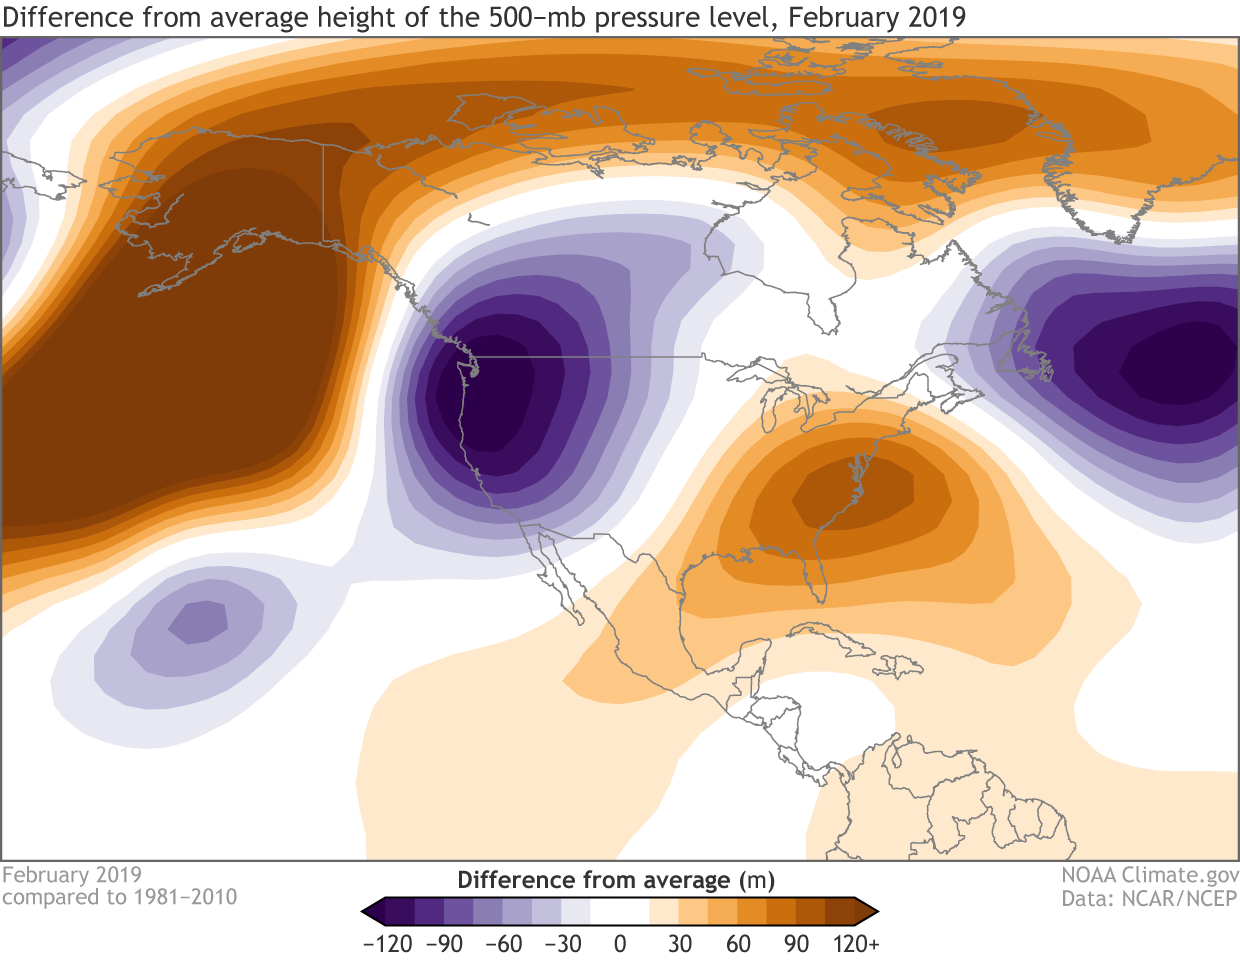 [Average 500-hPa height anomaly for February 2019. During this time period, the atmosphere flipped into a negative Pacific/North American Pattern which is noted by a higher than normal height of the 500-hPA level in the eastern Pacific and southeastern United States and lower than normal heights in the western United States. Extremely below-average monthly temperatures were observed across the northwestern United States during February 2019. NOAA Climate image based on data from NCEP/NCAR Reanalysis.]
A negative PNA phase is associated with a ridge of higher pressure over the western Gulf of Alaska and the eastern United States and a trough of lower pressure over the northwestern United States. This pattern results in below-average temperatures over the West and Canada and above-average temperatures over the Southeast, which is exactly what happened in February.
But what caused this pattern? El Niño didn’t, as it is more often associated with a positive PNA phase. The answer could be atmospheric randomness. Even with influencing factors, the circulation over the Pacific and North America decided to do its own thing.
It’s for exactly this reason—the inherent randomness in our climate system—that CPC issues their seasonal outlooks in terms of probabilities. Forecasters have to take into account that while there could be various influencers like El Niño on the climate, the randomness of the atmosphere will also always be present, meaning we won’t know everything. As we wrote last October, we knew that El Niño, if it formed (and it did…. late), would be on the weaker side and likely not have a large influence, so our probabilities for particular El Niño-like impacts were not large.
[Average 500-hPa height anomaly for February 2019. During this time period, the atmosphere flipped into a negative Pacific/North American Pattern which is noted by a higher than normal height of the 500-hPA level in the eastern Pacific and southeastern United States and lower than normal heights in the western United States. Extremely below-average monthly temperatures were observed across the northwestern United States during February 2019. NOAA Climate image based on data from NCEP/NCAR Reanalysis.]
A negative PNA phase is associated with a ridge of higher pressure over the western Gulf of Alaska and the eastern United States and a trough of lower pressure over the northwestern United States. This pattern results in below-average temperatures over the West and Canada and above-average temperatures over the Southeast, which is exactly what happened in February.
But what caused this pattern? El Niño didn’t, as it is more often associated with a positive PNA phase. The answer could be atmospheric randomness. Even with influencing factors, the circulation over the Pacific and North America decided to do its own thing.
It’s for exactly this reason—the inherent randomness in our climate system—that CPC issues their seasonal outlooks in terms of probabilities. Forecasters have to take into account that while there could be various influencers like El Niño on the climate, the randomness of the atmosphere will also always be present, meaning we won’t know everything. As we wrote last October, we knew that El Niño, if it formed (and it did…. late), would be on the weaker side and likely not have a large influence, so our probabilities for particular El Niño-like impacts were not large.
[Winter temperature outlook for December-February 2018-2019, issued on November 15, 2018. The colors denote places where the forecast odds favor a much colder than usual winter (blue colors) or much warmer than usual winter (red), or where the probability of a cold winter, a warm winter, or a near-normal winter are all equal (white). The darker the color, the stronger the chance of that outcome (not the bigger the departure from average). NOAA Climate map, based on data from NOAA CPC.]
Starting off with temperature
The Winter Outlook issued on November 15, 2018, for December-February was one that tilted towards the warm side (1). The Climate Prediction Center (CPC) concluded that the odds of a warmer-than-average winter were higher than a near-average or colder-than-average winter over the entire country save for the East Coast and the Southeast, where there was an equal chance of any of the three outcomes. The highest chances for a warmer-than-average winter were located over the Pacific Northwest and Alaska, where probabilities exceeded 50%. Reality… well—and this is for all those GenXers out there—reality bites. Instead of a warmer-than-average Northern Plains, Pacific Northwest and West Coast, temperatures were colder than average. And the southeastern United States, a place where the winter outlook saw an equal chance of all options, was the warmest compared to average. Of course, if you’ve read these posts in the past, I routinely insist to readers to not rely on their eyes to make determinations on the quality of a particular outlook. So, am I saying that this outlook is better than it seems? Nope! I mean, did you SEE how different they were! (Pardon the cheekiness.)
[(left) Temperature forecast for December-February 2018-19, made in mid-November. The colors show the forecast category with the highest probability. White areas are where all three outcomes (warm, cool, or average) were equally likely (each had a 33.3% chance of happening). (right) Observed temperature category for December-February 2018-19. NOAA Climate image based on CPC data.]
To mathematically “see” how the outlook performed, scientists at the CPC use a verification metric known as the Heidke Skill Score (HSS) (2). The Heidke Skill Score is a simple way to see how often the outlook hit or missed and then—because no one is harder on us than we are on ourselves—compares that to how often we would have gotten the right answer just by luck. Any HSS greater than 0 means the outlook was better than random guessing.
Not surprisingly, the HSS for the 2018-2019 Winter Outlook was negative, -13 to be exact for the continental U.S. if we count all forecasts including areas with “equal chance,” and -20 if we only look at areas where forecasters made a choice to favor one outcome over the others (3). This was the lowest seasonal outlook HSS in almost six years (and lowest winter outlook score in 15 years).
Feel free to check out the numbers yourself at one of a number of public websites that the CPC maintains that looks at how their outlooks performed.
[Winter precipitation outlook for December-February 2018-2019 issued on November 15, 2018. The colors denote places where the forecast odds favor a much drier than usual winter (brown colors) or much wetter than usual winter (blue-green), or where the probability of a dry winter, a wet winter, or a near-normal winter are all equal (white). The darker the color, the stronger the chance of that outcome (not the bigger the departure from average) NOAA Climate map, based on data from NOAA CPC.]
Was the precipitation outlook any better?
It’d be hard to be worse, even when looking at a much more notoriously difficult thing to predict like precipitation (4). In the precipitation outlook, CPC forecasters concluded there was a tilt in the odds towards a wetter-than-average winter for the southern tier of the United States, stretching along the East Coast through New York. Meanwhile, they thought odds favored a drier-than-average winter across the Great Lakes. In actuality, wetter-than-average conditions extended across a much larger portion of the country as wetness reigned (get it...? reigned sounds like “rained.” I’ll let myself out). In fact, the only broad area that observed below-average amounts of precipitation was over southern and western Texas into New Mexico, an area where the outlook tilted towards a wetter-than-average winter.
[(left) Precipitation forecast for December-February 2018-19, made in mid-November. The colors show the forecast category with the highest probability. White areas are where all three outcomes (wet, dry, average) were equally likely (each had a 33.3% chance of happening). (right) Observed precipitation category for December-February 2018-19. NOAA Climate image based on CPC data.]
Even with that missed area, the 2018-2019 Winter Outlook had a HSS of 8 for the continental U.S. and 15 when only considering regions where forecasters leaned towards wetter, drier or near-normal. While not an incredibly high score, it was above zero, meaning it was better than random chance. It was in line with the average HSS for all seasonal precipitation outlooks over the last five years, and it was higher than the average score since 1995.
[Differences from average temperature across the continental United States during December 2018. Warmer than average conditions are denoted in red while colder than average conditions are in blue. Warmer than average temperatures were observed coast to coast during December 2018. NOAA Climate image using data from NCEI.]
So what the heck happened to that temperature outlook?
February happened. After the first two months of winter, the winter outlook did not look too bad. Temperatures in both December and January were generally warmer than average across much of the country. And while not perfect, the winter outlook did predict a tilt in the odds towards a warmer winter over much of the continental United States.
[Differences from average temperature across the continental United States during January 2019. Warmer than average conditions are denoted in red while colder than average conditions are in blue. In January 2019, most of the continental United States observed warmer than average temperatures except for around the Great Lakes. NOAA Climate image using data from NCEI.]
Then, in February, the western half of the country was transported to the ice planet Hoth. A huge area across the Northern Plains stretching into the Pacific Northwest observed temperatures more than 11°F below average for the month. February 2019 became the second-coldest February since 1895 in Montana and North Dakota, the third-coldest in South Dakota, and the fifth-coldest in Washington.
[Differences from average temperature across the continental United States during February 2019. Warmer than average conditions are denoted in red while colder than average conditions are in blue. In February 2019, much colder than average temperatures were recorded across the western and northern United States while the southeastern United States observed warmer than average temperatures. NOAA Climate image using data from NCEI.]
Atmospherically, when one half of the country is so cold, the other half usually experiences the opposite, like how pushing in one side of a balloon makes the opposite side get bigger. So as the central and western United States froze, the Southeast experienced a top-ten-warmest February.
These monthly temperature extremes in February were large enough to change the generally warm, coast-to-coast pattern seen during December and January into the final winter temperature anomaly observed above.
Thus, the winter outlook was looking good for roughly two-thirds of the season; only February’s craziness turned a good outlook into a not so good one.
So what happened in February then?
The big change during February when compared to December and January was that the Pacific/North American Pattern (PNA)—a specific type of pattern in the atmosphere that occurs across the mid-latitudes in the Pacific and North America—shifted phase from slightly positive to negative.
[Average 500-hPa height anomaly for February 2019. During this time period, the atmosphere flipped into a negative Pacific/North American Pattern which is noted by a higher than normal height of the 500-hPA level in the eastern Pacific and southeastern United States and lower than normal heights in the western United States. Extremely below-average monthly temperatures were observed across the northwestern United States during February 2019. NOAA Climate image based on data from NCEP/NCAR Reanalysis.]
A negative PNA phase is associated with a ridge of higher pressure over the western Gulf of Alaska and the eastern United States and a trough of lower pressure over the northwestern United States. This pattern results in below-average temperatures over the West and Canada and above-average temperatures over the Southeast, which is exactly what happened in February.
But what caused this pattern? El Niño didn’t, as it is more often associated with a positive PNA phase. The answer could be atmospheric randomness. Even with influencing factors, the circulation over the Pacific and North America decided to do its own thing.
It’s for exactly this reason—the inherent randomness in our climate system—that CPC issues their seasonal outlooks in terms of probabilities. Forecasters have to take into account that while there could be various influencers like El Niño on the climate, the randomness of the atmosphere will also always be present, meaning we won’t know everything. As we wrote last October, we knew that El Niño, if it formed (and it did…. late), would be on the weaker side and likely not have a large influence, so our probabilities for particular El Niño-like impacts were not large.
What’s next?
These sorts of “failed” outlooks put the complexity of seasonal outlooks into perspective. All it takes is one month’s extremes to flip the script on the seasonal story. And while there has been considerable progress in our ability to forecast seasonal climate, it is still incredibly difficult to impossible to predict how certain natural climate phenomena will evolve two to three months in advance. But that is not to say that seasonal predictions are useless based on one poor forecast, and this is why we encourage folks to play the long game. Winter temperature outlooks since 1996 have an average HSS of 16.5 (over 25 in areas where a forecast of above-, near-, or below-average was made), which means that taken as a whole, the seasonal outlooks are better than a random guess. If you’d metaphorically placed a bet each winter according to the outlook for the past two decades, you’d have made more money than if you’d just guessed above-, below-, or near-average each a third of the time. In fact, only a few outlooks dating back over the last five years have been worse than a roll of a three-sided die. It just so happened that the recent winter outlook was one of those forecasts. https://twitter.com/NOAAComms/status/1108747170121945094Footnotes
(1) First, the winter outlook noted here is the one made in November 2018. When we wrote about the winter outlook for the ENSO blog last fall that was in relation to the winter outlook made in October. While similar, the two forecasts were different. Also, the winter outlook actually covers meteorological winter, December-February, and not the period from the winter solstice through spring equinox. And when I say tilt in the odds, I refer to the probabilistic nature of the forecasts where forecasters assign probabilities to three categories, well-above, well-below, and near-average which all must add up to 100%. Well-above and well-below refer to the top or bottom third of observed winter average temperatures or precipitation during the climatological reference period, which is currently 1981-2010. (2) Want a refresher on what the Heidke Skill Score is? Go here! (3) Why are there two Heidke Skill Scores? Because there are different ways of dealing with regions where the outlook gives an equal chance to all three categories. We can either verify the entire outlook as is, including those areas with equal chances. Or we can verify just the locations where forecasters tilted the odds to one category or another. Both methods reward different kinds of forecasting. Verifying an outlook that includes areas with equal chance, the HSS can be maximized by a forecaster making non-equal chance predictions wherever there is a signal, regardless of confidence. Meanwhile, the HSS can be maximized for verifications excluding the equal chance areas by a forecaster making predictions only over small areas where their confidence is highest. Both are useful. (4) Precipitation forecasts are harder than temperature forecasts due to the more variable nature of precipitation than temperature. One large precipitation event can skew the seasonal totals which lead to a noisier precipitation pattern than temperature. Edited for WeatherNation by Meteorologist Mace MichaelsAll Weather News
More
Hurricane Flossie Continues to Weaken
Hurricane FlossieThe National Hurricane Cente
3 Jul 2025 2:50 AM

NHC Monitoring Front in the Southeast Ahead of 4th of July
Later this week, a frontal boundary is expect
3 Jul 2025 1:00 AM

Northern Plains to Upper Midwest Severe Storms Threaten Holiday Travel
NORTHERN PLAINS - A frontal system is expecte
3 Jul 2025 1:00 AM


Northwest Heat Met With Thunderstorm Risk
NORTHWEST - Today, portions of Montana are un
3 Jul 2025 12:00 AM

Near Seasonal Temperatures for Many Come July 4th!
AAA is expecting over 70 million travelers to
2 Jul 2025 6:40 PM

Severe Weather Threat Continues in the Midwest
It has been an active, severe season across t
30 Jun 2025 9:00 PM