Half of the World's Annual Precipitation Falls in Just 12 Days
"This study shows how those two pieces fit together," said Angeline Pendergrass, a scientist at the National Center for Atmospheric Research (NCAR) and the lead author of the new study. "What we found is that the expected increases happen when it's already the wettest — the rainiest days get rainier."
The findings, which suggest that flooding and the damage associated with it could also increase, have implications for water managers, urban planners, and emergency responders. The research results are also a concern for agriculture, which is more productive when rainfall is spread more evenly over the growing season.

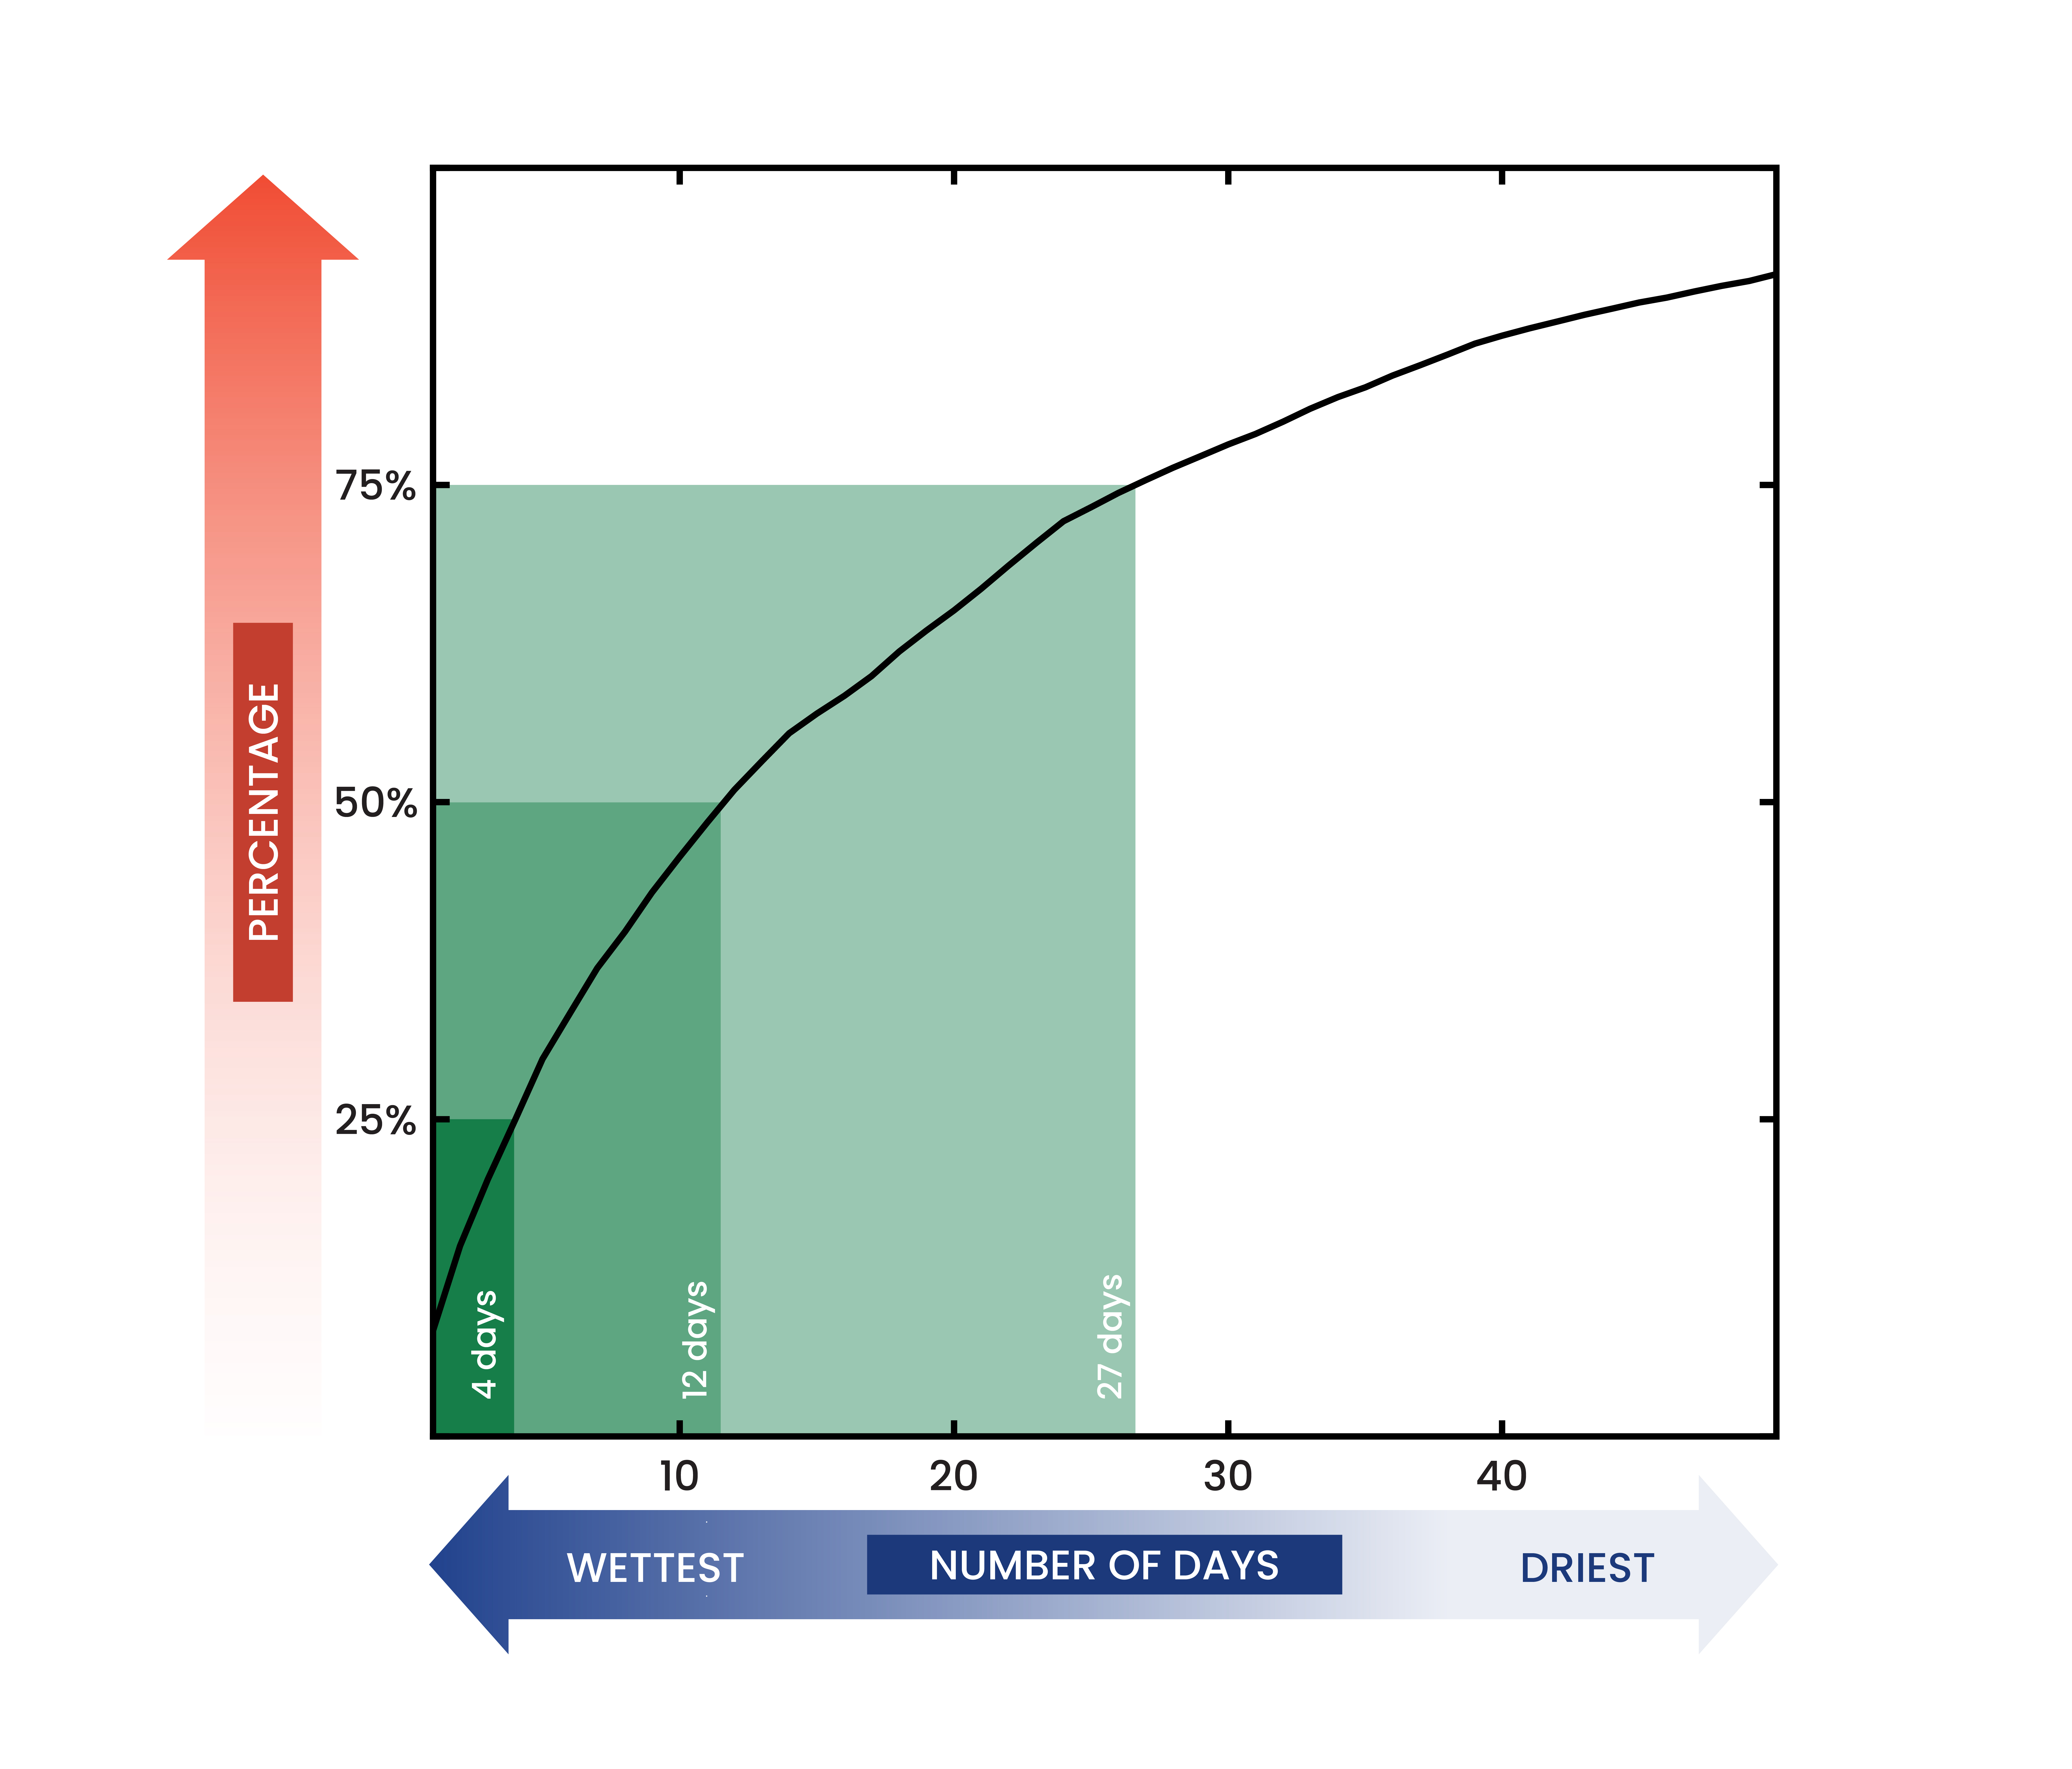
[An analysis of rainfall measured at weather stations across the globe between 1999 and 2014 found that the median time it took for half of a year’s precipitation to fall was just 12 days. A quarter of annual precipitation fell in just six days, and three-quarters fell in 27 days. Image: Simmi Sinha via NCAR/UCAR]
WHAT IT MEANS TO BE EXTREME
Scientists who study extreme precipitation have used a variety of metrics to define what qualifies as "extreme." Pendergrass noticed that in some cases the definitions were so broad that extreme precipitation events actually included the bulk of all precipitation. In those instances, "extreme precipitation" and "average precipitation" became essentially the same thing.
Pendergrass wanted to find something even simpler and more intuitive that could be easily understood by both the public and other scientists. In the end, she chose to quantify the number of days it would take for half of a year's precipitation to fall. The results surprised her.
"I would have guessed the number would be larger — perhaps a month," she said. "But when we looked at the median, or midpoint, from all the available observation stations, the number was just 12 days."

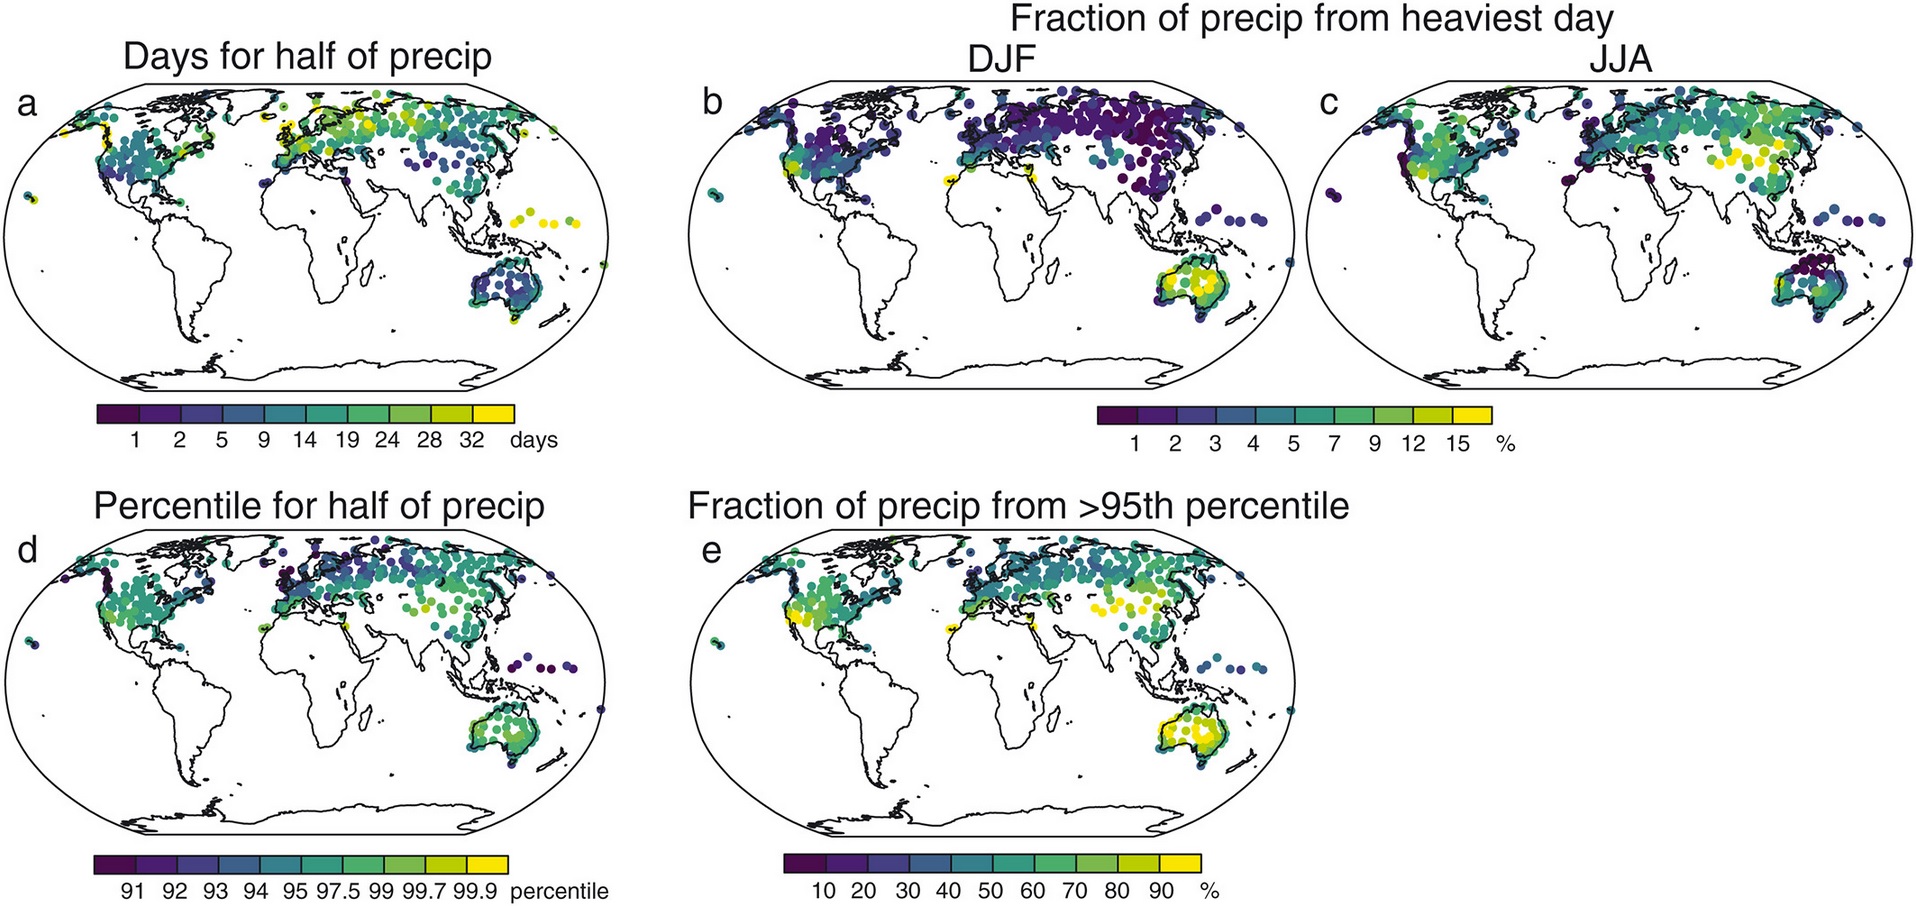
[Unevenness of precipitation observed at stations. (a) Days per year for half of precipitation, and the fraction of annual precipitation falling on the wettest day each season: (b) December, January, and February (DJF) and (c) June, July, and August (JJA). (d) All‐day percentile for half of precipitation and (e) fraction of precipitation occurring beyond the 95th all‐day percentile. White indicates no data. Note that stations poleward of 50° are included. From NCAR/UCAR]
For the analysis, Pendergrass worked with Reto Knutti, of the Institute for Atmospheric and Climate Science in Zurich, Switzerland. They used data from 185 ground stations for the 16 years from 1999 through 2014, a period when measurements could be validated against data from the Tropical Rainfall Measuring Mission (TRMM) satellite. While the stations were dispersed globally, the majority were in North America, Eurasia, and Australia.
Edited for WeatherNation by Meteorologist Mace Michaels