A Look at the Excessive Rainfall from Hurricane Willa in Mexico and Texas
Special Stories
29 Oct 2018 8:33 AM
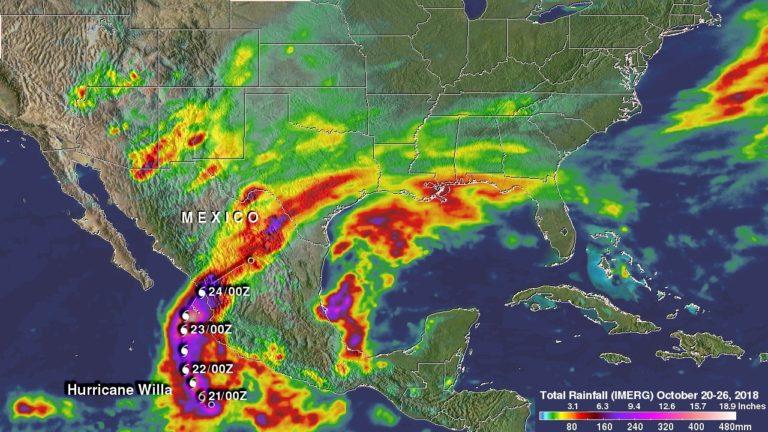
[A rainfall accumulation analysis was generated by totaling Integrated Multi-satellitE Retrievals for GPM (IMERG) data for the period from October 20 to 26, 2018. Hurricane Willa’s approximate 0000Z and 1200Z locations are shown on this analysis. Willa produced rainfall totals greater than 20 inches (508 mm) in the Pacific Ocean off Mexico’s coast. IMERG data also indicated that rainfall accumulations of over 15 inches (381 mm) occurred in parts of Mexico and Southeastern Texas. Credit: NASA/JAXA, Hal Pierce]
[NASA] Satellite data is used to calculate the amount of rainfall generated from tropical cyclones. The merging of multiple images and techniques showed excessive rainfall occurred from Hurricane Willa in Texas and Mexico.
Tropical Depression 24E formed on October 20, 2018 and later in the day became tropical storm Willa. The tropical depression rapidly intensified and was a category five hurricane with winds of over 161 mph (140 knots) on October 22. Willa had weakened to category three intensity when it made landfall in Sinaloa, Mexico on October 24, 2018. Moisture streaming from Willa’s remnants added to the soaking of the already water logged state of Texas. Moisture from Willa’s remnants contributed to storms over the Southeast and to the developing Nor’easter moving over the East Coast.
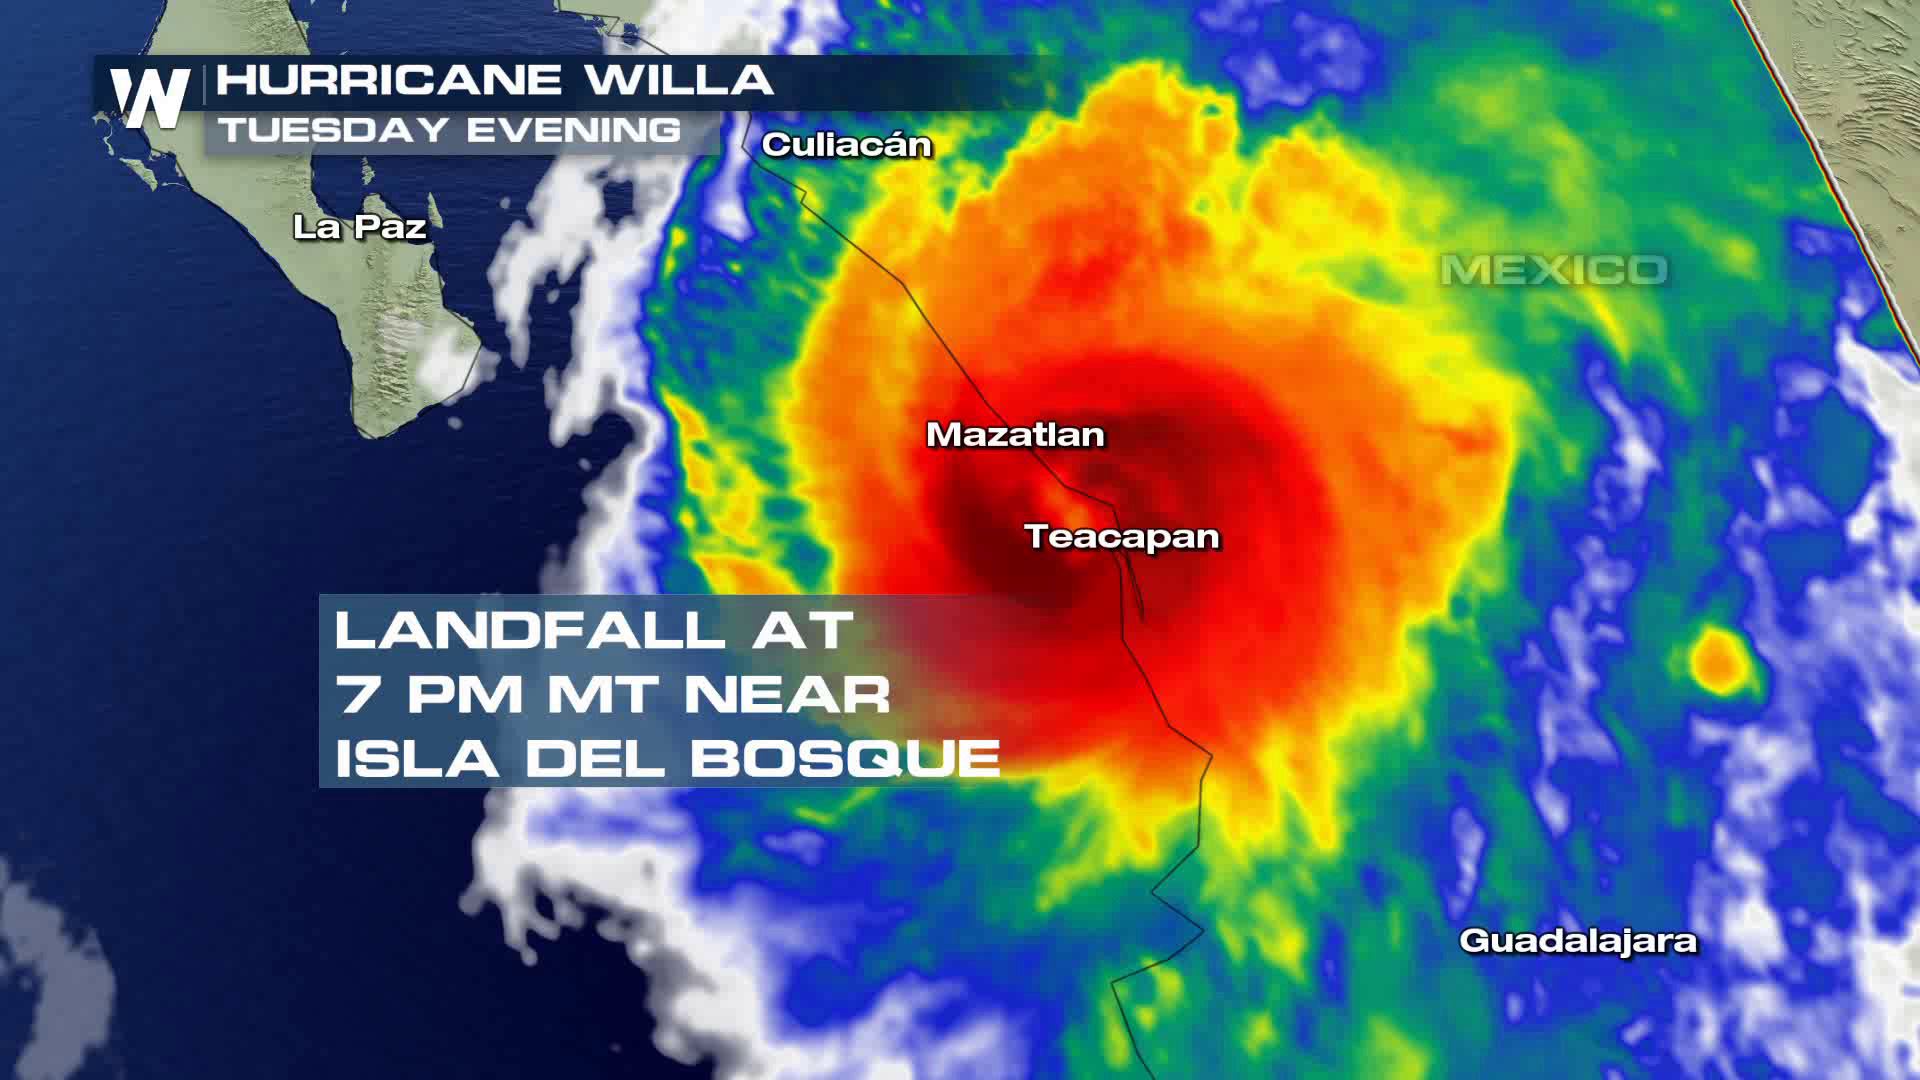 [Hurricane Willa landfall on October 24, 2018]
At NASA’s Goddard Space Flight Center in Greenbelt, Maryland a rainfall accumulation analysis was generated by totaling Integrated Multi-satellitE Retrievals for GPM (IMERG) data for the period from October 20 to 26, 2018. The IMERG rainfall accumulation data indicated that Willa produced rainfall totals greater than 20 inches (508 mm) in the Pacific Ocean off Mexico’s coast. IMERG data also indicated that rainfall accumulations of over 15 inches (381 mm) occurred in parts of Mexico and Southeastern Texas.
IMERG data are generated every half hour by NASA’s Precipitation Processing System by merging data from the satellites in the GPM Constellation, and calibrating those data with measurements from the GPM Core Observatory as well as rain gauge networks around the world. IMERG data are provided for much of the globe. Full coverage is calculated over latitudes from 60 degrees north to 60 degrees south with the remaining areas of the globe being partially covered.
https://www.youtube.com/watch?v=HgyUKnvVjB0
[A rainfall accumulation analysis was generated by totaling Integrated Multi-satellitE Retrievals for GPM (IMERG) data for the period from October 20 to 26, 2018. Hurricane Willa’s approximate 0000Z and 1200Z locations are shown on this analysis. Willa produced rainfall totals greater than 20 inches (508 mm) in the Pacific Ocean off Mexico’s coast. IMERG data also indicated that rainfall accumulations of over 15 inches (381 mm) occurred in parts of Mexico and Southeastern Texas. Credit: NASA/JAXA, Hal Pierce]
The Integrated Multi-satellitE Retrievals for GPM (IMERG) creates a merged precipitation product from the GPM constellation of satellites. These satellites include DMSPs from the U.S. Department of Defense, GCOM-W from the Japan Aerospace Exploration Agency (JAXA), Megha-Tropiques from the Centre National D’etudies Spatiales (CNES) and Indian Space Research Organization (ISRO), NOAA series from the National Oceanic and Atmospheric Administration (NOAA), Suomi-NPP from NOAA-NASA, and MetOps from the European Organisation for the Exploitation of Meteorological Satellites (EUMETSAT). All of the instruments (radiometers) onboard the constellation partners are intercalibrated with information from the GPM Core Observatory’s GPM Microwave Imager (GMI) and Dual-frequency Precipitation Radar (DPR).
Edited for WeatherNation by Meteorologist Mace Michaels
[Hurricane Willa landfall on October 24, 2018]
At NASA’s Goddard Space Flight Center in Greenbelt, Maryland a rainfall accumulation analysis was generated by totaling Integrated Multi-satellitE Retrievals for GPM (IMERG) data for the period from October 20 to 26, 2018. The IMERG rainfall accumulation data indicated that Willa produced rainfall totals greater than 20 inches (508 mm) in the Pacific Ocean off Mexico’s coast. IMERG data also indicated that rainfall accumulations of over 15 inches (381 mm) occurred in parts of Mexico and Southeastern Texas.
IMERG data are generated every half hour by NASA’s Precipitation Processing System by merging data from the satellites in the GPM Constellation, and calibrating those data with measurements from the GPM Core Observatory as well as rain gauge networks around the world. IMERG data are provided for much of the globe. Full coverage is calculated over latitudes from 60 degrees north to 60 degrees south with the remaining areas of the globe being partially covered.
https://www.youtube.com/watch?v=HgyUKnvVjB0
[A rainfall accumulation analysis was generated by totaling Integrated Multi-satellitE Retrievals for GPM (IMERG) data for the period from October 20 to 26, 2018. Hurricane Willa’s approximate 0000Z and 1200Z locations are shown on this analysis. Willa produced rainfall totals greater than 20 inches (508 mm) in the Pacific Ocean off Mexico’s coast. IMERG data also indicated that rainfall accumulations of over 15 inches (381 mm) occurred in parts of Mexico and Southeastern Texas. Credit: NASA/JAXA, Hal Pierce]
The Integrated Multi-satellitE Retrievals for GPM (IMERG) creates a merged precipitation product from the GPM constellation of satellites. These satellites include DMSPs from the U.S. Department of Defense, GCOM-W from the Japan Aerospace Exploration Agency (JAXA), Megha-Tropiques from the Centre National D’etudies Spatiales (CNES) and Indian Space Research Organization (ISRO), NOAA series from the National Oceanic and Atmospheric Administration (NOAA), Suomi-NPP from NOAA-NASA, and MetOps from the European Organisation for the Exploitation of Meteorological Satellites (EUMETSAT). All of the instruments (radiometers) onboard the constellation partners are intercalibrated with information from the GPM Core Observatory’s GPM Microwave Imager (GMI) and Dual-frequency Precipitation Radar (DPR).
Edited for WeatherNation by Meteorologist Mace MichaelsAll Weather News
More

More Storms for the East Through Monday
A low-pressure system that moved through the
3 Aug 2026 12:20 PM


After Reaching Category 5, Genevieve Weakens in the Pacific
PacificGenevieve formed last Friday south of
3 Aug 2026 12:30 AM

Flooding, Severe Storms Target the Midwest Again
After an active week of storms across the nor
1 Aug 2026 1:40 AM

Flooding Risk Increases as Heavy Rain Targets the Tri-State Area
Tuesday, heavy rainfall moved across the Nort
30 Jul 2026 12:25 AM