Are You Dreaming of a White Christmas? A Look at the Chances in Your Backyard

Special Stories
6 Dec 2019 2:35 AM
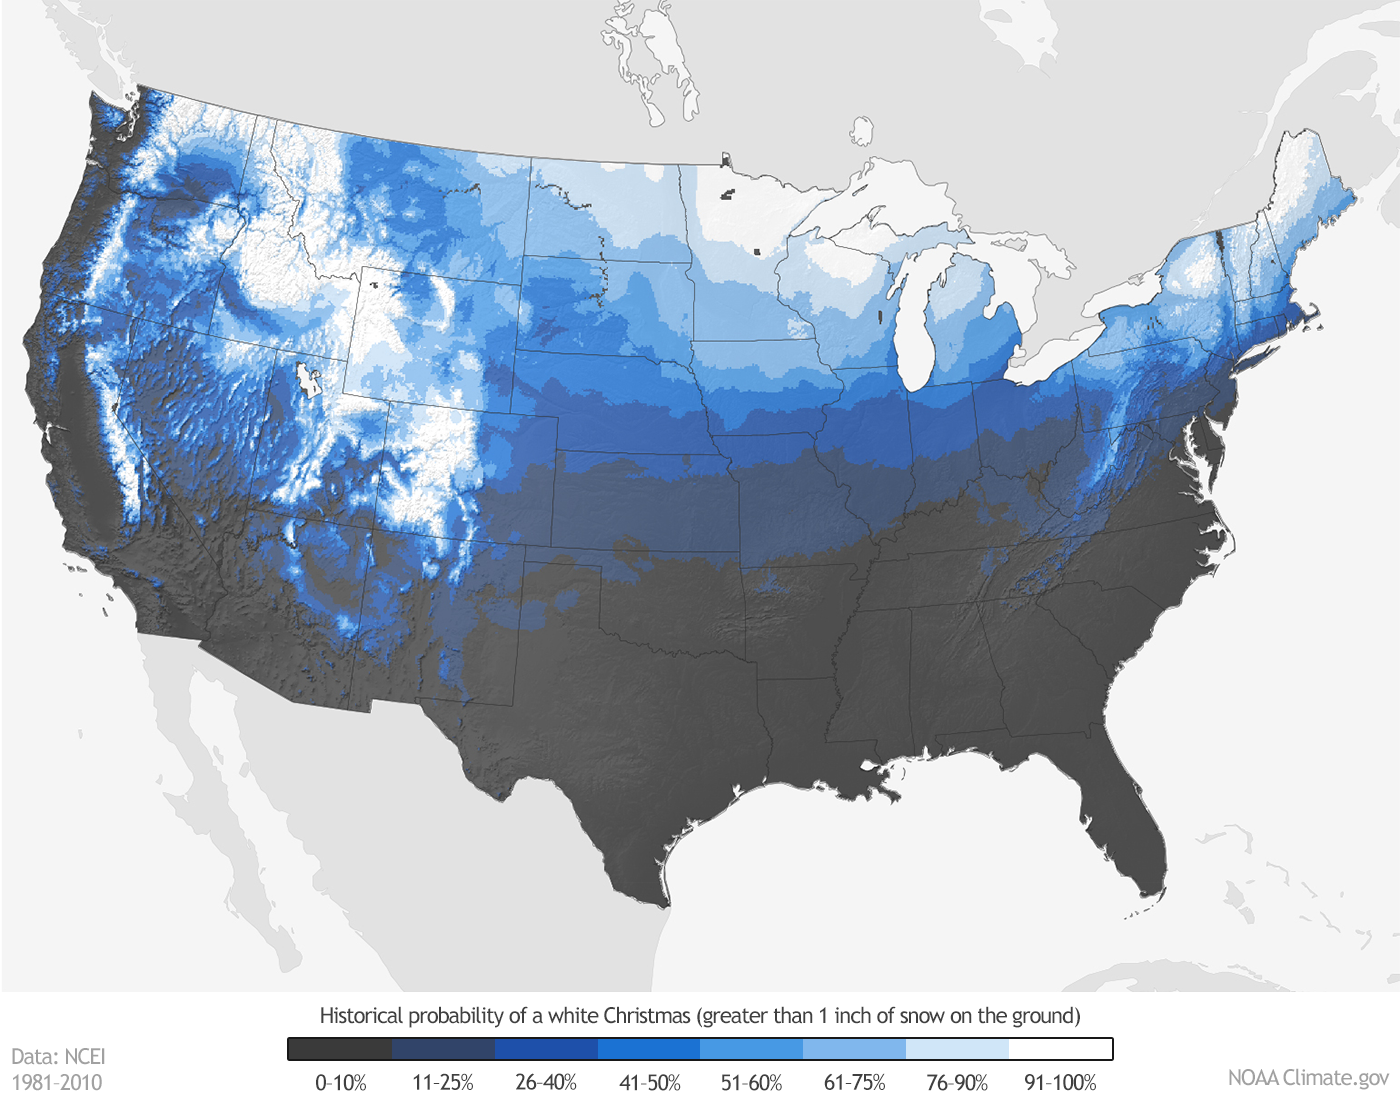
[NOAA by Susan Osborne & Rebecca Lindsey] Minnesota. Maine. Upstate New York. The Allegheny Mountains of Pennsylvania and West Virginia. Practically anywhere in Idaho. And of course, the Rockies or the Sierra Nevada Mountains. These are the parts of the Lower 48 where weather history suggests you want to be if you're looking for the best chance of a white Christmas.
The map below shows the historic probability of there being at least 1 inch of snow on the ground in the Lower 48 states on December 25 based on the latest (1981-2010) U.S. Climate Normals from NOAA's National Centers for Environmental Information (NCEI). The background map shows interpolated values for all locations. (Interpolating means estimating unknown values using known values and physical relationships, such as the way temperature is known to change with altitude.) Darkest gray shows places where the probability is less than 10%. (Sorry West Coast, Gulf Coast, Deep South!) White shows probabilities greater than 90 percent.
 The 1981–2010 Climate Normals are the latest three-decade averages of several climatological measurements. This collection contains daily and monthly normals of temperature, precipitation, snowfall, heating and cooling degree days, frost/freeze dates, and growing-degree days calculated from observations at approximately 9,800 stations operated by NOAA’s National Weather Service.
While the map shows the historical probability that a snow depth of at least one inch will be observed on December 25, the actual conditions in any year may vary widely from these because the weather patterns present will determine the snow on the ground or snowfall on Christmas day. These probabilities are useful as a guide only to show where snow on the ground is more likely.
The 1981–2010 Climate Normals are the latest three-decade averages of several climatological measurements. This collection contains daily and monthly normals of temperature, precipitation, snowfall, heating and cooling degree days, frost/freeze dates, and growing-degree days calculated from observations at approximately 9,800 stations operated by NOAA’s National Weather Service.
While the map shows the historical probability that a snow depth of at least one inch will be observed on December 25, the actual conditions in any year may vary widely from these because the weather patterns present will determine the snow on the ground or snowfall on Christmas day. These probabilities are useful as a guide only to show where snow on the ground is more likely.
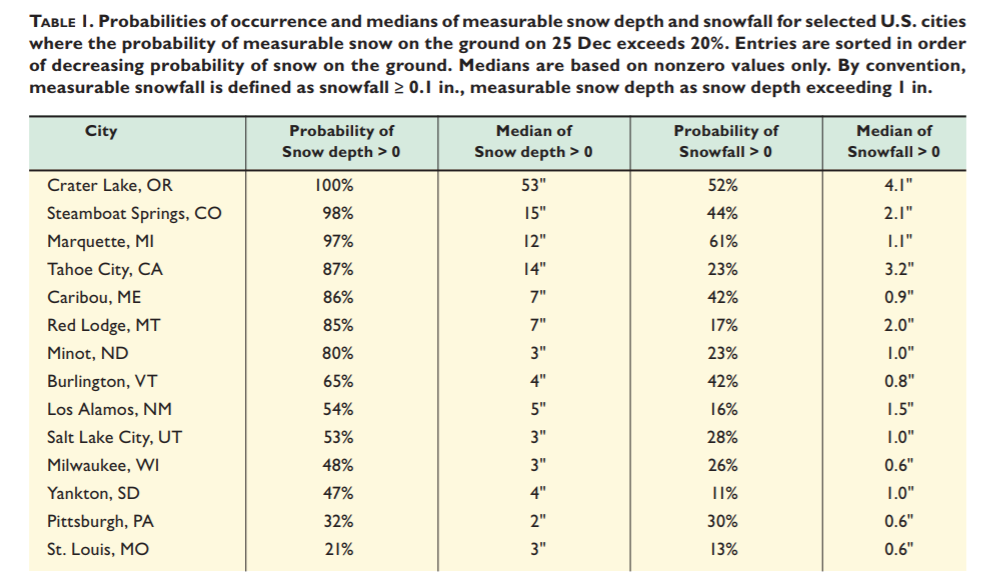 [Table from AMS]
If you would like to keep track of the snowfall across the United States on a daily basis, see the National Operational Hydrologic Remote Sensing Center’s National Snow Analyses. For a more detailed assessment of the probability of a white Christmas as well as documentation of the methodology used to calculate the map’s underlying climatological statistics, see the scientific paper, White Christmas? An Application of NOAA’s 1981-2010 Daily Normals, by NCEI scientists and published in the Bulletin of the American Meteorological Society. You can also download a spreadsheet to see the full list of stations and their historic probabilities.
[Table from AMS]
If you would like to keep track of the snowfall across the United States on a daily basis, see the National Operational Hydrologic Remote Sensing Center’s National Snow Analyses. For a more detailed assessment of the probability of a white Christmas as well as documentation of the methodology used to calculate the map’s underlying climatological statistics, see the scientific paper, White Christmas? An Application of NOAA’s 1981-2010 Daily Normals, by NCEI scientists and published in the Bulletin of the American Meteorological Society. You can also download a spreadsheet to see the full list of stations and their historic probabilities.
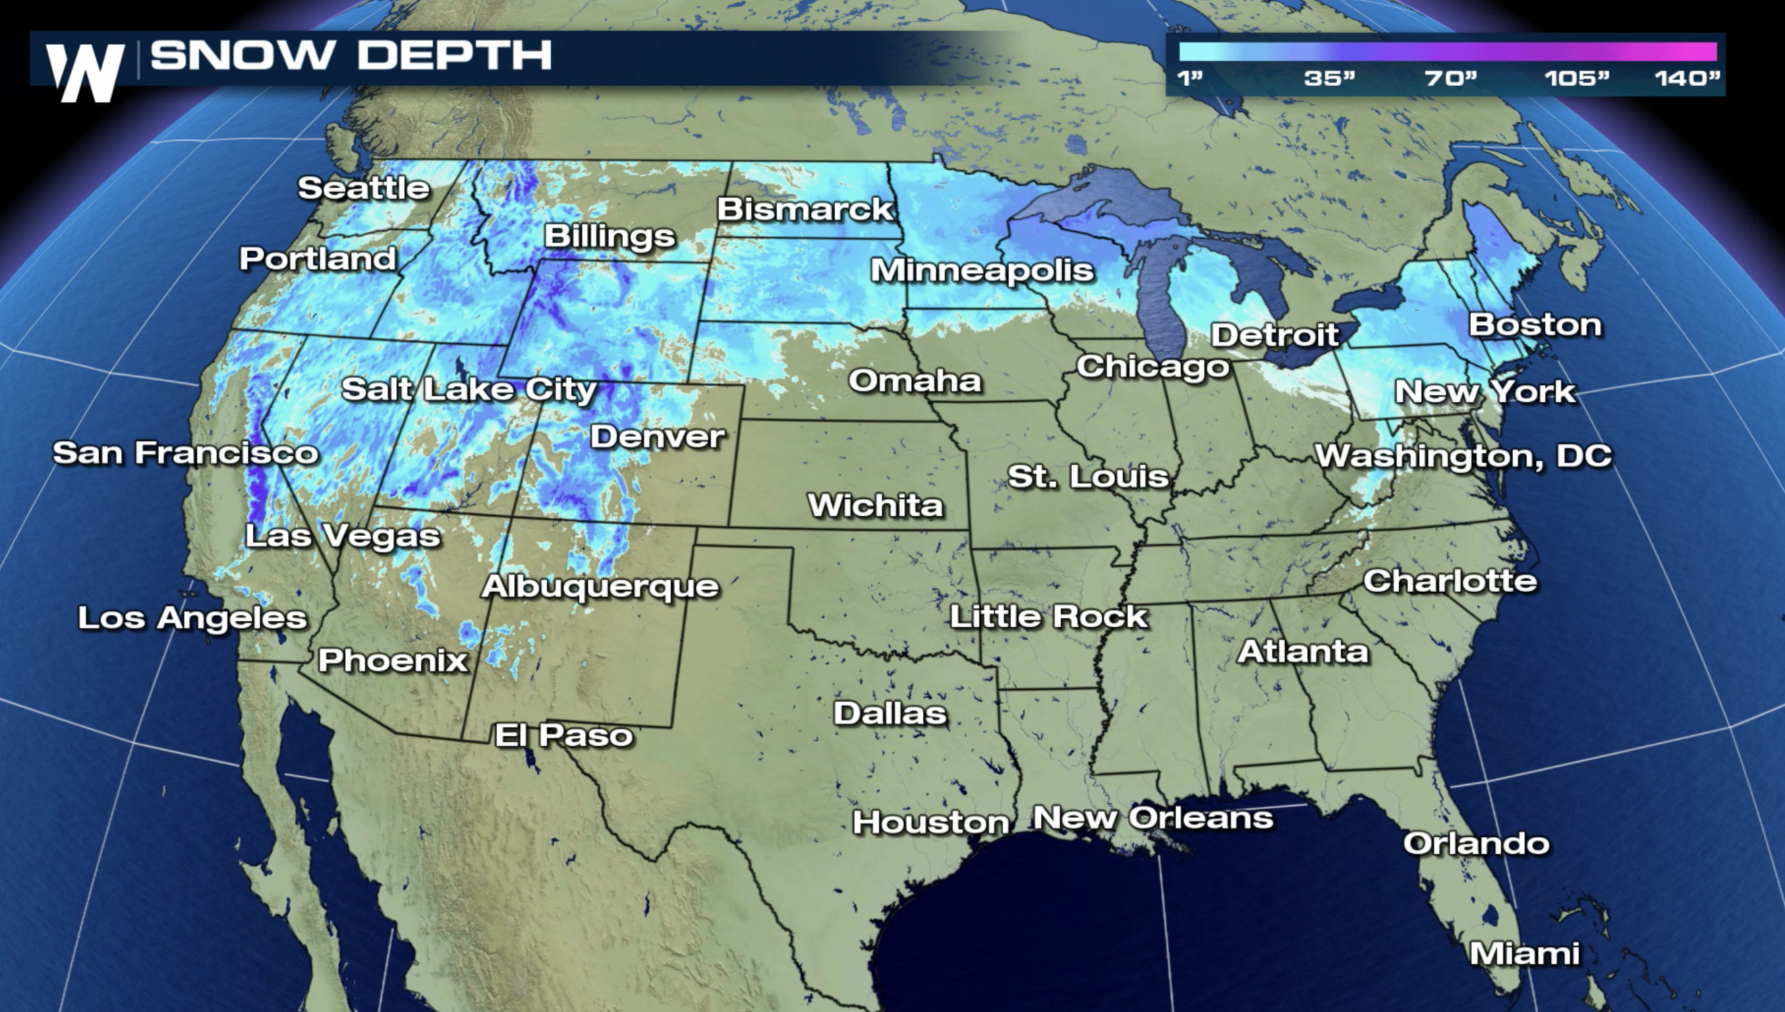 [snow depth as of Thursday, 12/5/2019]
The 1981–2010 Climate Normals are the latest three-decade averages of several climatological measurements. This collection contains daily and monthly normals of temperature, precipitation, snowfall, heating and cooling degree days, frost/freeze dates, and growing-degree days calculated from observations at approximately 9,800 stations operated by NOAA’s National Weather Service.
While the map shows the historical probability that a snow depth of at least one inch will be observed on December 25, the actual conditions in any year may vary widely from these because the weather patterns present will determine the snow on the ground or snowfall on Christmas day. These probabilities are useful as a guide only to show where snow on the ground is more likely.
[Table from AMS]
If you would like to keep track of the snowfall across the United States on a daily basis, see the National Operational Hydrologic Remote Sensing Center’s National Snow Analyses. For a more detailed assessment of the probability of a white Christmas as well as documentation of the methodology used to calculate the map’s underlying climatological statistics, see the scientific paper, White Christmas? An Application of NOAA’s 1981-2010 Daily Normals, by NCEI scientists and published in the Bulletin of the American Meteorological Society. You can also download a spreadsheet to see the full list of stations and their historic probabilities.
[snow depth as of Thursday, 12/5/2019]All Weather News
More
Wildfire Outbreak in the Pacific Northwest
SPOKANE, WA - On Saturday, August 1st, the Ol
3 Aug 2026 1:55 AM

More Storms for the East Through Monday
A low-pressure system that moved through the
3 Aug 2026 1:50 AM


After Reaching Category 5, Genevieve Weakens in the Pacific
PacificGenevieve formed last Friday south of
3 Aug 2026 12:30 AM

Flooding, Severe Storms Target the Midwest Again
After an active week of storms across the nor
1 Aug 2026 1:40 AM

Flooding Risk Increases as Heavy Rain Targets the Tri-State Area
Tuesday, heavy rainfall moved across the Nort
30 Jul 2026 12:25 AM

Severe Weather: Energy From the Midwest Now in the Southeast
UPPER MIDWEST - Through Monday, dangerous tor
29 Jul 2026 10:30 PM