NASA's ECOSTRESS Maps LA's Hot Spots
Special Stories
19 Sep 2018 1:19 PM
[Los Angeles skyline. From Pixabay]
From NASA
NASA's ECOsystem Spaceborne Thermal Radiometer Experiment on Space Station (ECOSTRESS) captured new imagery of variations in surface-temperature patterns in Los Angeles County. The first of its kind to be taken by the agency's newest Earth-observing mission, it is more detailed than previous imagery and, unlike prior imagery, was acquired at different times of the day.
ECOSTRESS measures surface temperature -- the temperature you would feel if you touched the surface of something -- rather than the air temperature typically reported by weather stations. The images were acquired throughout the day between July 22 and Aug. 14 during an extended period of high temperatures in the Los Angeles area.
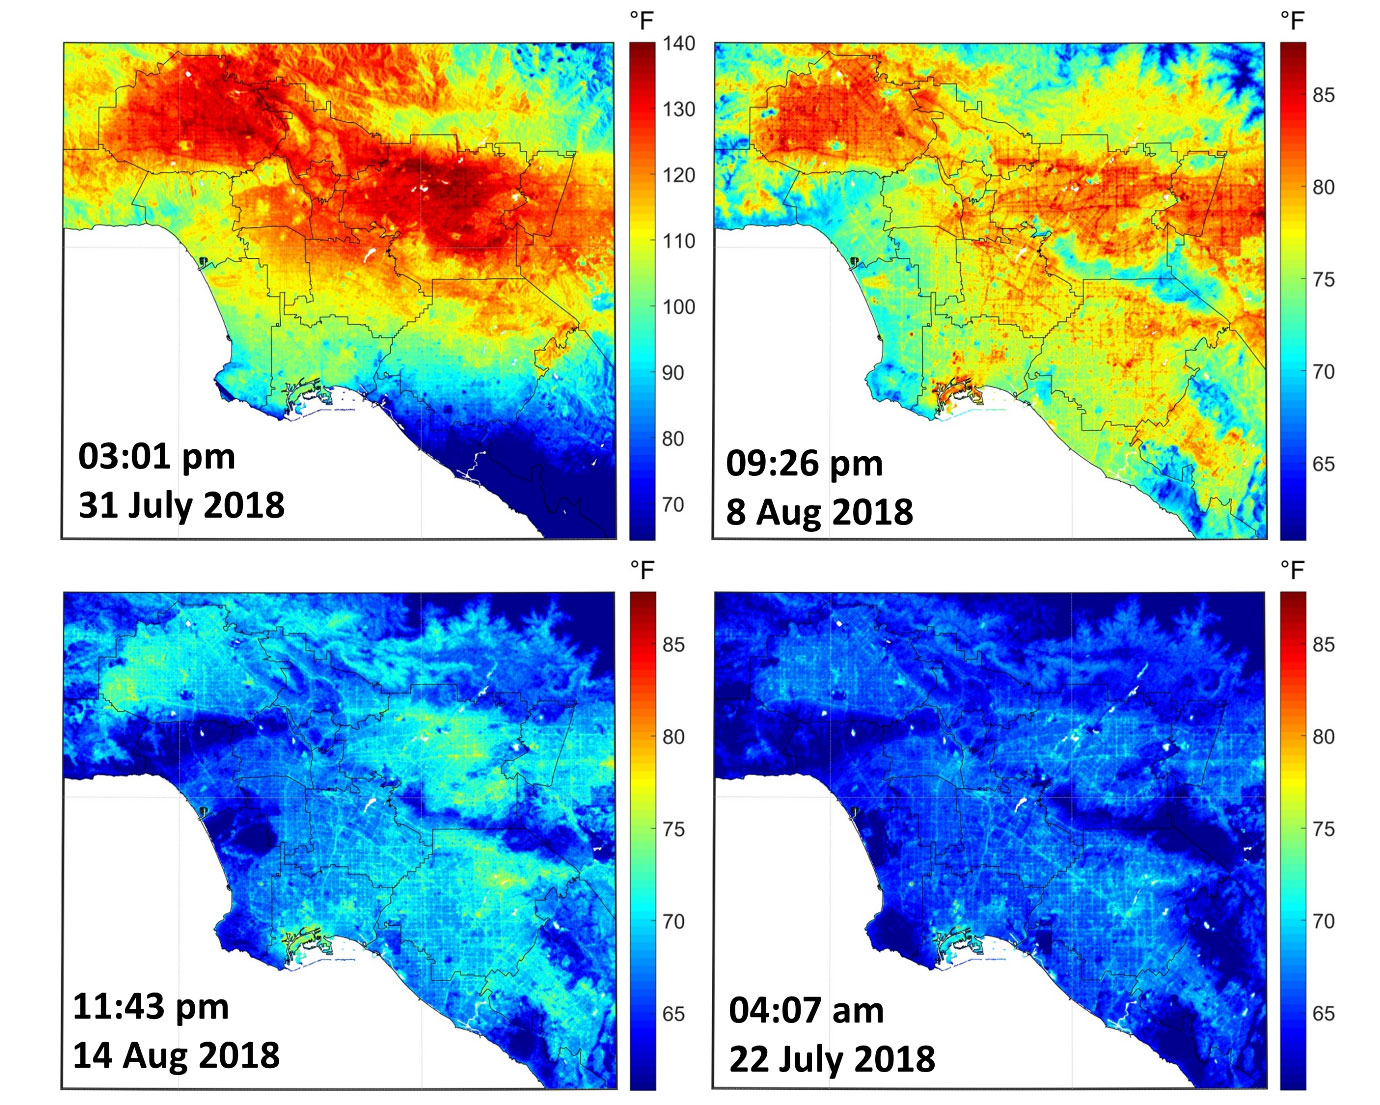 [ECOSTRESS imagery shows surface temperature variations in Los Angeles, California between July 22 and August 14 at different times of day. Hot areas are shown in red, warm areas in orange and yellow, and cooler areas in blue.]
Cooler temperatures appear in blue, and warmer temperatures are shown in red. In the image taken July 22 at 4:07 a.m., the hottest (reddest) areas are dark asphalt surfaces that are unshaded during the day and remain warm throughout the night. They include freeways, airports, oil refineries and parking lots. The cool (blue) areas are clouds and higher-elevation mountainous regions (dark blue).
The other images show how different urban surfaces warm up and cool down throughout the day. The daytime image (upper left) acquired at 3:01 p.m. PDT on July 31 shows how hot the inland regions can get during a period of extreme heat. The Santa Anita racetrack parking lot was the hottest area. At 147.3° F, the surface temperature there was hot enough to fry an egg.
Images in the upper right, lower left and lower right -- acquired at 9:26 p.m., 11:43 p.m. and 4:07 a.m., respectively -- show how urban surfaces cool down, with roof surfaces cooling at a much faster rate than roads and other asphalt surfaces that have a higher heat capacity. Note that in the lower-right image, reds correspond with temperatures in the 80s. The top image from the same time shows a slightly different scale to enhance the contrast between different surfaces -- and reds correspond with temperatures in the 70s.
[ECOSTRESS imagery shows surface temperature variations in Los Angeles, California between July 22 and August 14 at different times of day. Hot areas are shown in red, warm areas in orange and yellow, and cooler areas in blue.]
Cooler temperatures appear in blue, and warmer temperatures are shown in red. In the image taken July 22 at 4:07 a.m., the hottest (reddest) areas are dark asphalt surfaces that are unshaded during the day and remain warm throughout the night. They include freeways, airports, oil refineries and parking lots. The cool (blue) areas are clouds and higher-elevation mountainous regions (dark blue).
The other images show how different urban surfaces warm up and cool down throughout the day. The daytime image (upper left) acquired at 3:01 p.m. PDT on July 31 shows how hot the inland regions can get during a period of extreme heat. The Santa Anita racetrack parking lot was the hottest area. At 147.3° F, the surface temperature there was hot enough to fry an egg.
Images in the upper right, lower left and lower right -- acquired at 9:26 p.m., 11:43 p.m. and 4:07 a.m., respectively -- show how urban surfaces cool down, with roof surfaces cooling at a much faster rate than roads and other asphalt surfaces that have a higher heat capacity. Note that in the lower-right image, reds correspond with temperatures in the 80s. The top image from the same time shows a slightly different scale to enhance the contrast between different surfaces -- and reds correspond with temperatures in the 70s.
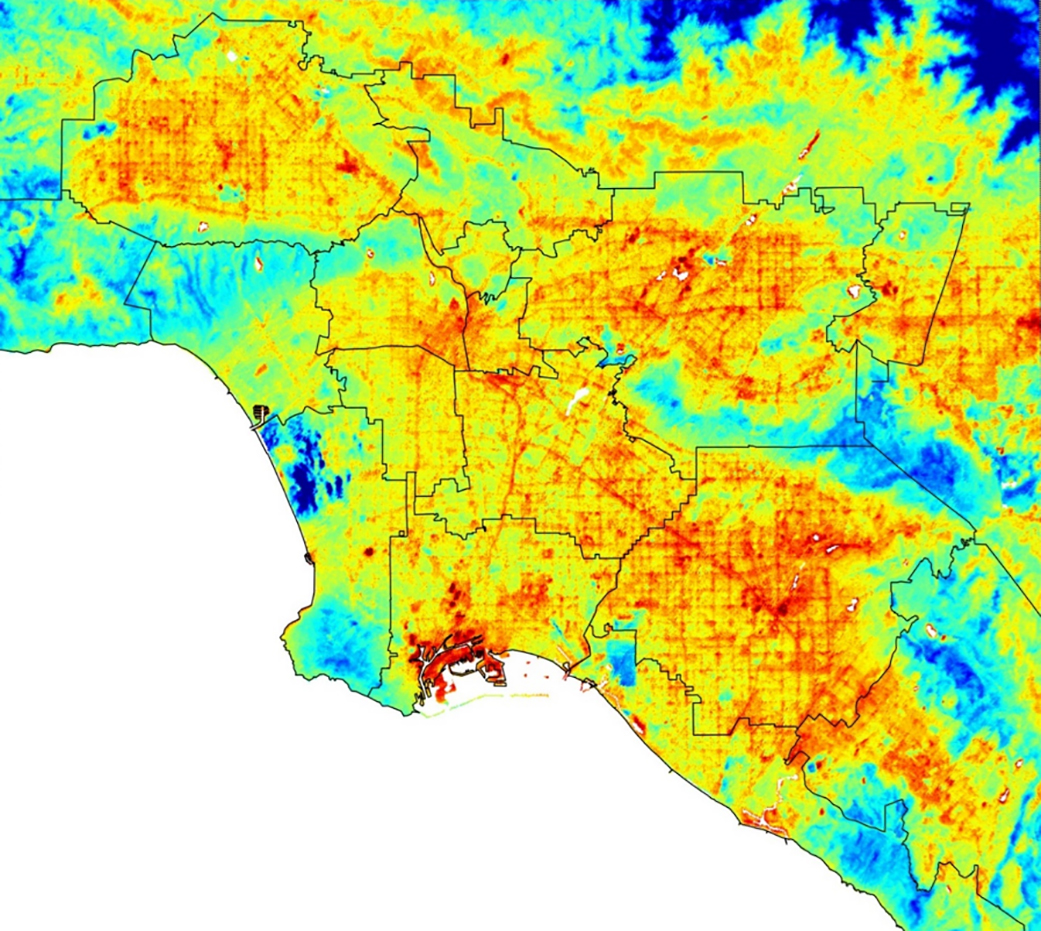 [ECOSTRESS captured surface temperature variations in Los Angeles, CA in the early morning hours of July 22. Hot areas are shown in red, warm areas in orange and yellow, and cooler areas in blue.]
The Los Angeles area is known for its Mediterranean climate and abundant sunshine but also for its extreme "micro-climate" temperature swings -- from cooler coastal areas to much warmer inland regions like the San Gabriel Valley. ECOSTRESS can detect the distribution and pattern variations of that surface heat over areas the size of a football field.
ECOSTRESS launched on June 29 as part of a SpaceX commercial resupply mission to the International Space Station. The primary mission of ECOSTRESS is to detect plant health by monitoring Earth's surface temperature. However, surface temperature data are also useful in detecting other heat-related phenomena, such as heat waves, volcanoes and fires.
JPL built and manages the ECOSTRESS mission for NASA's Earth Science Division in the Science Mission Directorate at NASA Headquarters in Washington. ECOSTRESS is an Earth Venture Instrument mission; the program is managed by NASA's Earth System Science Pathfinder program at NASA's Langley Research Center in Hampton, Virginia.
Edited for WeatherNation by Meteorologist Mace Michaels
[ECOSTRESS captured surface temperature variations in Los Angeles, CA in the early morning hours of July 22. Hot areas are shown in red, warm areas in orange and yellow, and cooler areas in blue.]
The Los Angeles area is known for its Mediterranean climate and abundant sunshine but also for its extreme "micro-climate" temperature swings -- from cooler coastal areas to much warmer inland regions like the San Gabriel Valley. ECOSTRESS can detect the distribution and pattern variations of that surface heat over areas the size of a football field.
ECOSTRESS launched on June 29 as part of a SpaceX commercial resupply mission to the International Space Station. The primary mission of ECOSTRESS is to detect plant health by monitoring Earth's surface temperature. However, surface temperature data are also useful in detecting other heat-related phenomena, such as heat waves, volcanoes and fires.
JPL built and manages the ECOSTRESS mission for NASA's Earth Science Division in the Science Mission Directorate at NASA Headquarters in Washington. ECOSTRESS is an Earth Venture Instrument mission; the program is managed by NASA's Earth System Science Pathfinder program at NASA's Langley Research Center in Hampton, Virginia.
Edited for WeatherNation by Meteorologist Mace Michaels
[ECOSTRESS imagery shows surface temperature variations in Los Angeles, California between July 22 and August 14 at different times of day. Hot areas are shown in red, warm areas in orange and yellow, and cooler areas in blue.]
Cooler temperatures appear in blue, and warmer temperatures are shown in red. In the image taken July 22 at 4:07 a.m., the hottest (reddest) areas are dark asphalt surfaces that are unshaded during the day and remain warm throughout the night. They include freeways, airports, oil refineries and parking lots. The cool (blue) areas are clouds and higher-elevation mountainous regions (dark blue).
The other images show how different urban surfaces warm up and cool down throughout the day. The daytime image (upper left) acquired at 3:01 p.m. PDT on July 31 shows how hot the inland regions can get during a period of extreme heat. The Santa Anita racetrack parking lot was the hottest area. At 147.3° F, the surface temperature there was hot enough to fry an egg.
Images in the upper right, lower left and lower right -- acquired at 9:26 p.m., 11:43 p.m. and 4:07 a.m., respectively -- show how urban surfaces cool down, with roof surfaces cooling at a much faster rate than roads and other asphalt surfaces that have a higher heat capacity. Note that in the lower-right image, reds correspond with temperatures in the 80s. The top image from the same time shows a slightly different scale to enhance the contrast between different surfaces -- and reds correspond with temperatures in the 70s.
[ECOSTRESS captured surface temperature variations in Los Angeles, CA in the early morning hours of July 22. Hot areas are shown in red, warm areas in orange and yellow, and cooler areas in blue.]
The Los Angeles area is known for its Mediterranean climate and abundant sunshine but also for its extreme "micro-climate" temperature swings -- from cooler coastal areas to much warmer inland regions like the San Gabriel Valley. ECOSTRESS can detect the distribution and pattern variations of that surface heat over areas the size of a football field.
ECOSTRESS launched on June 29 as part of a SpaceX commercial resupply mission to the International Space Station. The primary mission of ECOSTRESS is to detect plant health by monitoring Earth's surface temperature. However, surface temperature data are also useful in detecting other heat-related phenomena, such as heat waves, volcanoes and fires.
JPL built and manages the ECOSTRESS mission for NASA's Earth Science Division in the Science Mission Directorate at NASA Headquarters in Washington. ECOSTRESS is an Earth Venture Instrument mission; the program is managed by NASA's Earth System Science Pathfinder program at NASA's Langley Research Center in Hampton, Virginia.
Edited for WeatherNation by Meteorologist Mace MichaelsAll Weather News
More


More Storms for the East Sunday and Monday
A low-pressure system crashing through the Mi
2 Aug 2026 2:20 AM

After Reaching Category 5, Genevieve Weakens in the Pacific
PacificGenevieve formed on last Friday south
2 Aug 2026 1:30 AM

Flooding, Severe Storms Target the Midwest Again
After an active week of storms across the nor
1 Aug 2026 1:40 AM

Flooding Risk Increases as Heavy Rain Targets the Tri-State Area
Tuesday, heavy rainfall moved across the Nort
30 Jul 2026 12:25 AM

Severe Weather: Energy From the Midwest Now in the Southeast
UPPER MIDWEST - Through Monday, dangerous tor
29 Jul 2026 10:30 PM