November La Niña Update: Conditions Likely to Stay for a While
Special Stories
21 Nov 2021 12:30 PM
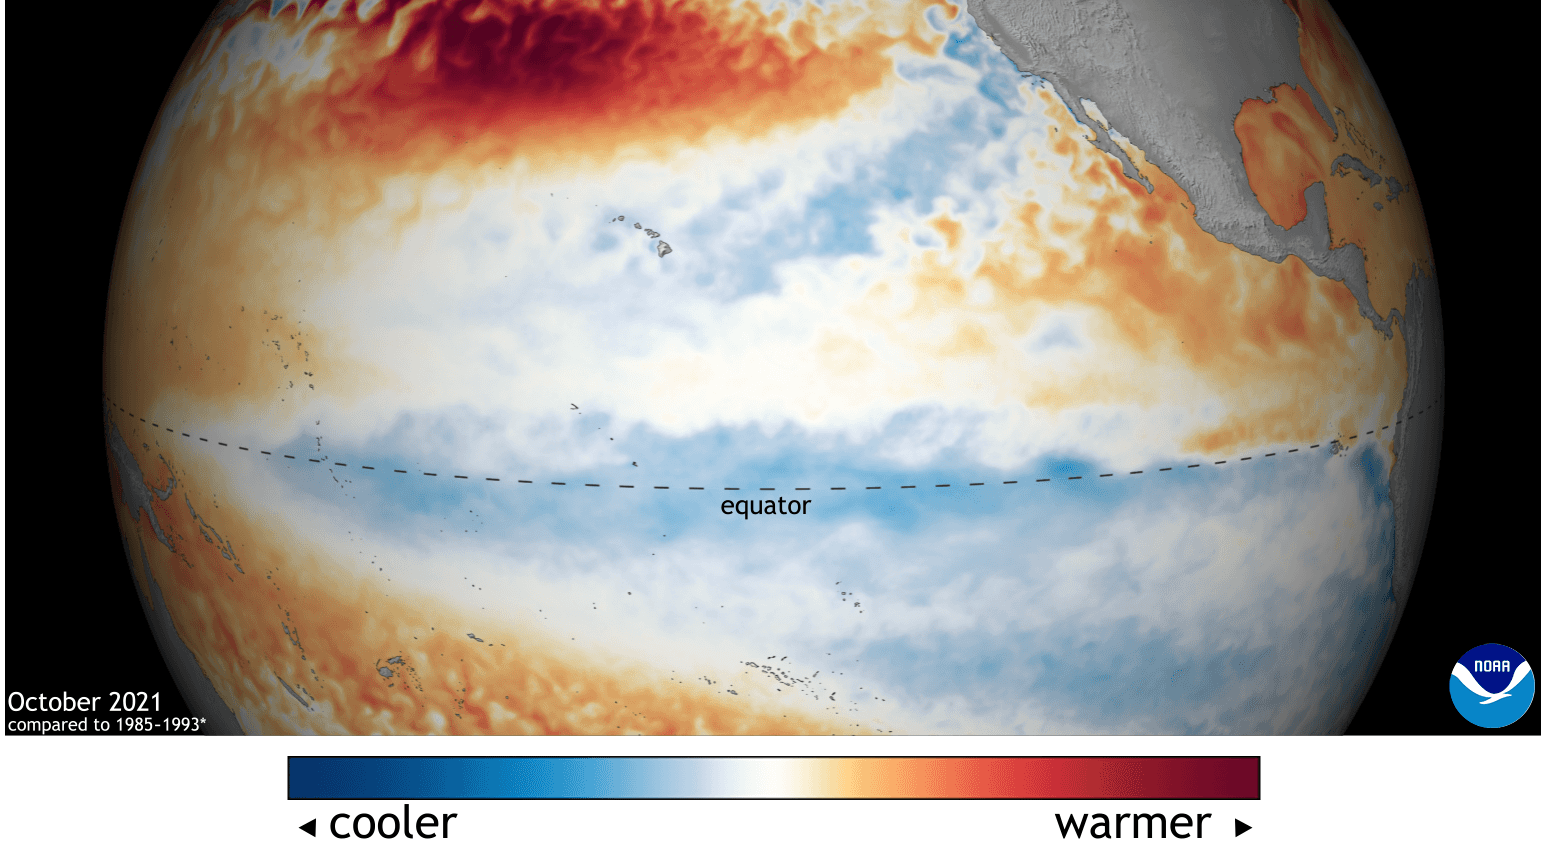
[October 2021 sea surface temperature departure. Image from Data Snapshots on NOAA Climate.]
[From NOAA Climate written by Emily Becker] La Niña conditions reign in the tropical Pacific, with about a 90% chance of remaining through the winter. Get your popcorn and settle down on the couch—it’s time for this month’s ENSO cinema.
 [La Niña feedbacks between the ocean and atmosphere. Climate.gov schematic by Emily Eng and inspired by NOAA PMEL.]
Romantic comedy
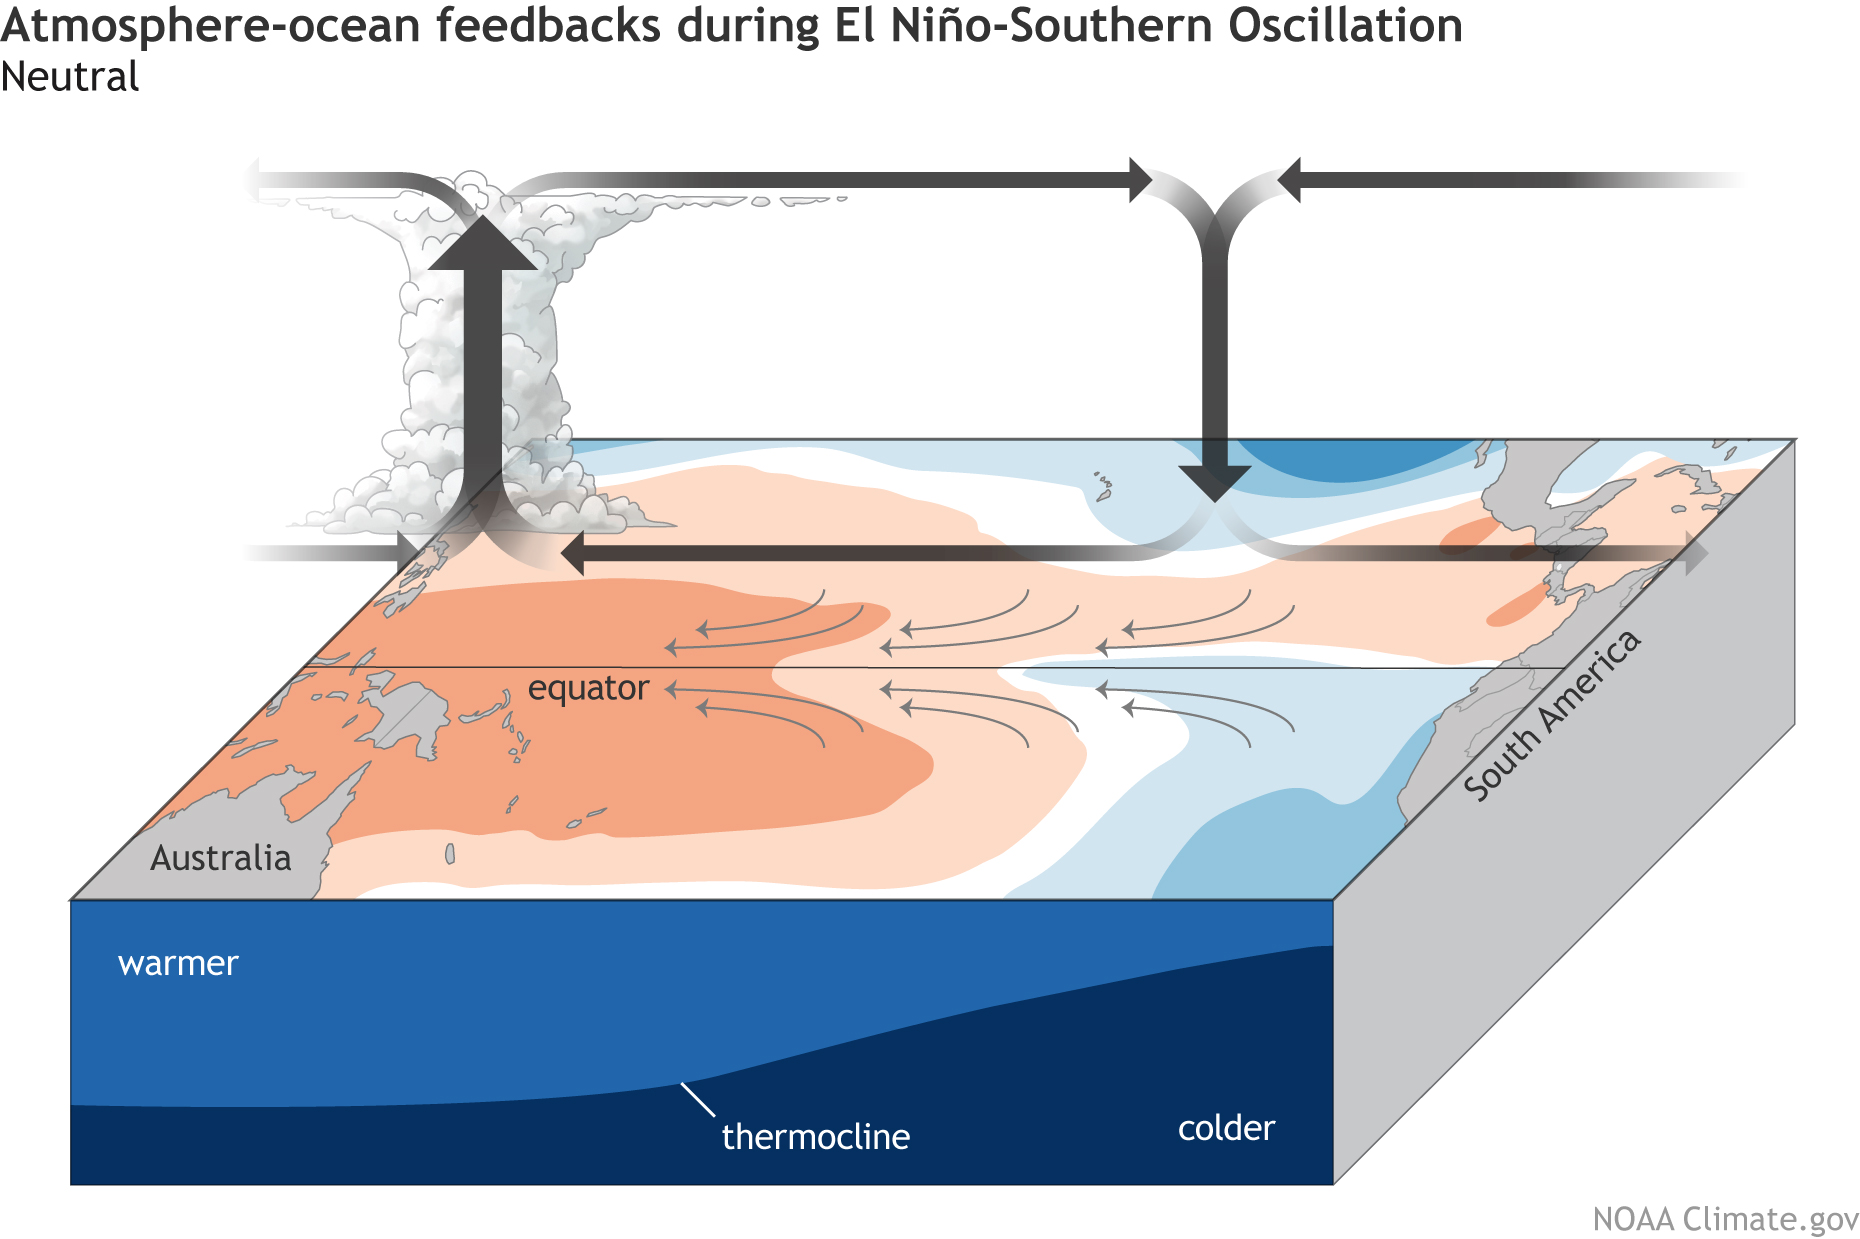
A recurring theme here at the ENSO Blog is the on-again, off-again relationship between the tropical Pacific Ocean and atmosphere. ENSO (short for El Niño-Southern Oscillation, the entire El Niño–La Niña system) relies on the interaction between the ocean and the atmosphere. Average conditions in the tropical Pacific (see the drawing below) consist of relatively warmer surface water in the west and relatively cooler surface in the east. Air rises over the warm western water, forming clouds and rain; winds blow west-to-east high up in the atmosphere; air descends over the cooler east; winds blow east-to-west near the surface. Dun-dun-dunnn… it’s the Walker circulation![ENSO-Neutral or average conditions across the tropical Pacific Ocean. Climate.gov schematic by Emily Eng and inspired by NOAA PMEL.]
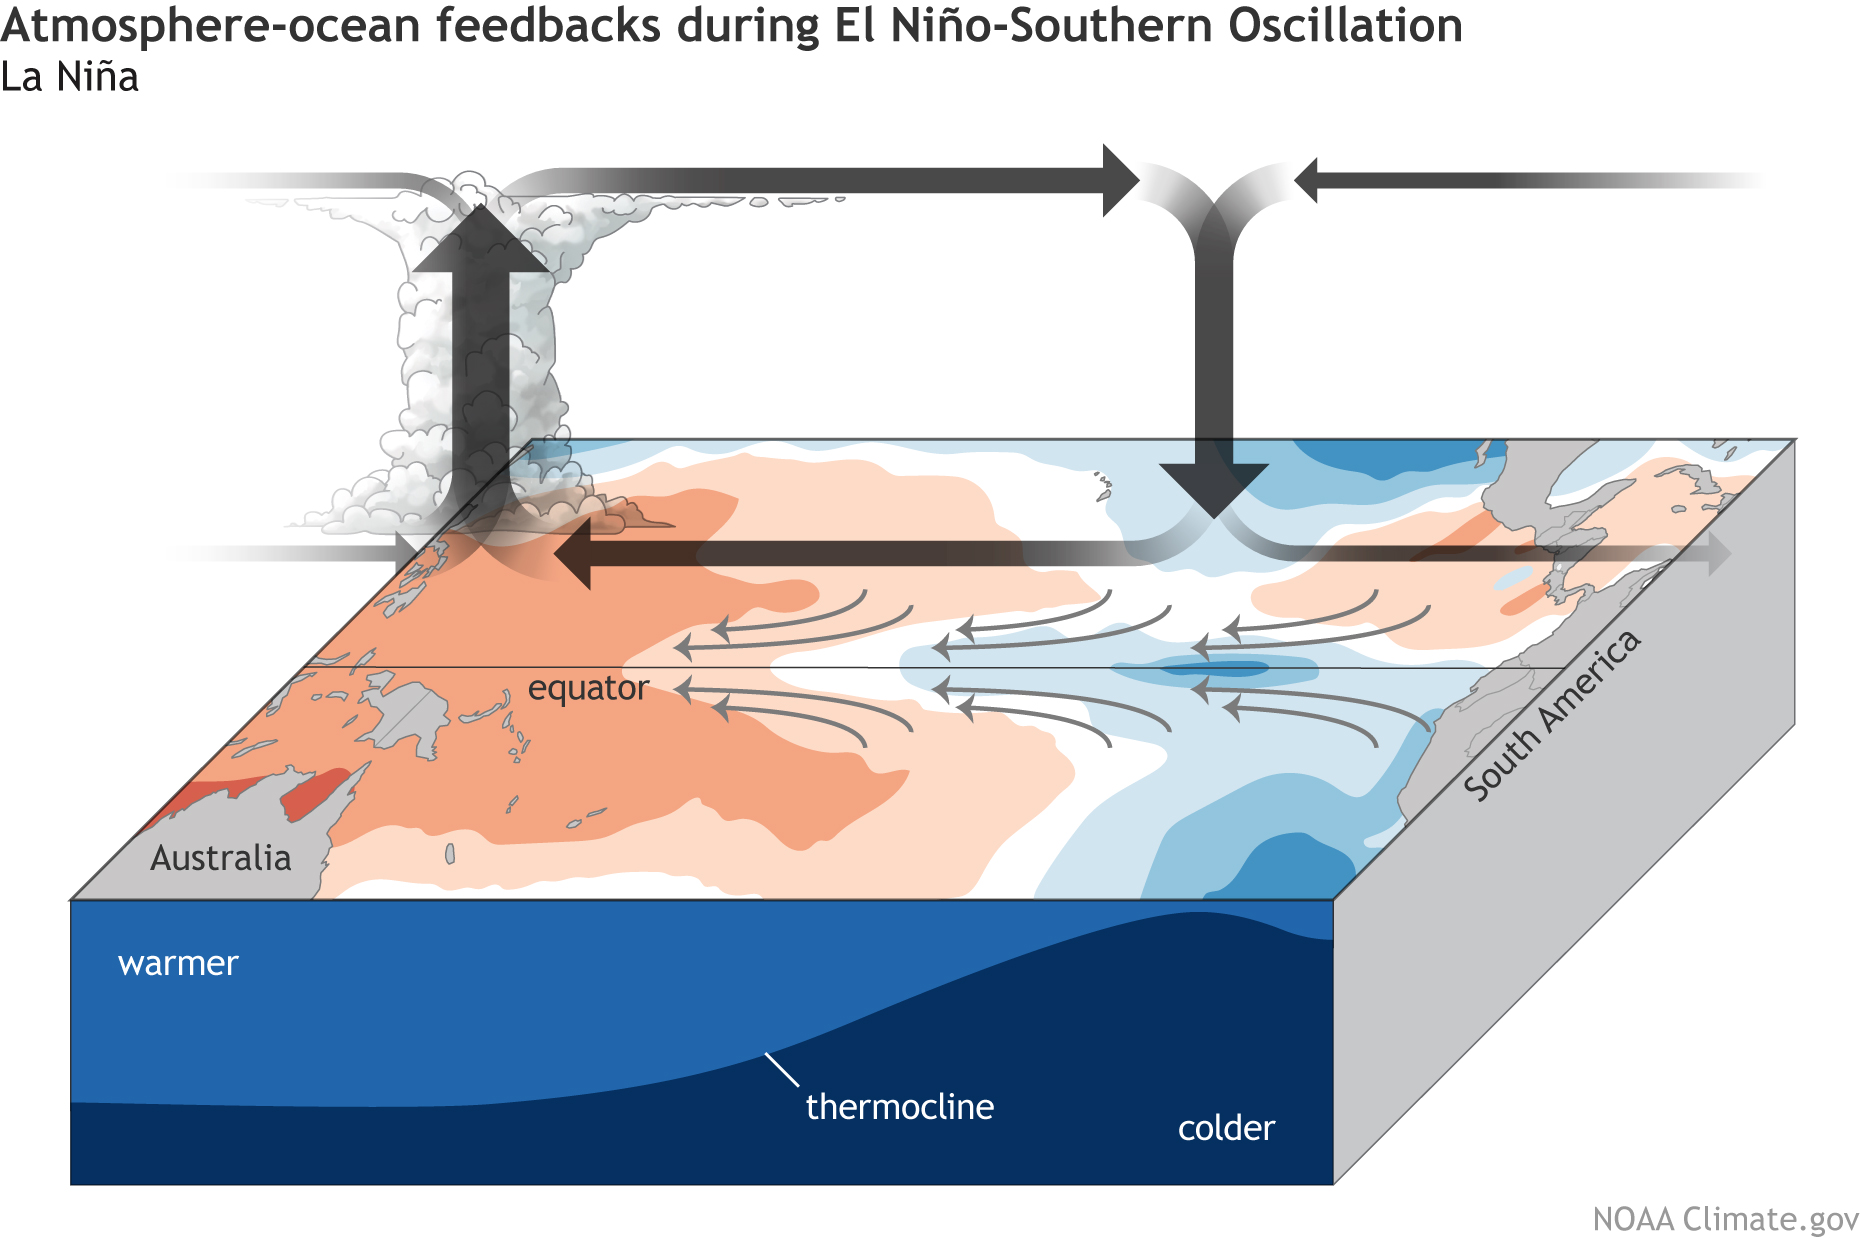
When La Niña is present, the atmosphere takes one look at that characteristic cooler-than-average central/eastern Pacific ocean surface and gets all amped up. I haven’t yet seen the Walker circulation standing outside La Niña’s house holding a boombox aloft, but ENSO is always full of surprises.
[La Niña feedbacks between the ocean and atmosphere. Climate.gov schematic by Emily Eng and inspired by NOAA PMEL.]
The resulting stronger near-surface winds (the trade winds) reinforce the cooler ocean surface—the feedback mechanism fundamental to ENSO. For more on how this works, and a delectable bread analogy, check out Michelle’s Oscar-winning post.
All this is to say that La Niña conditions, after developing in September, continued in October. The surface of the ocean in the Niño-3.4 region, our primary ENSO-monitoring region, was about 1.0˚ C (1.8˚ F) cooler than the long-term average, via the ERSSTv5, our primary ENSO-monitoring dataset.
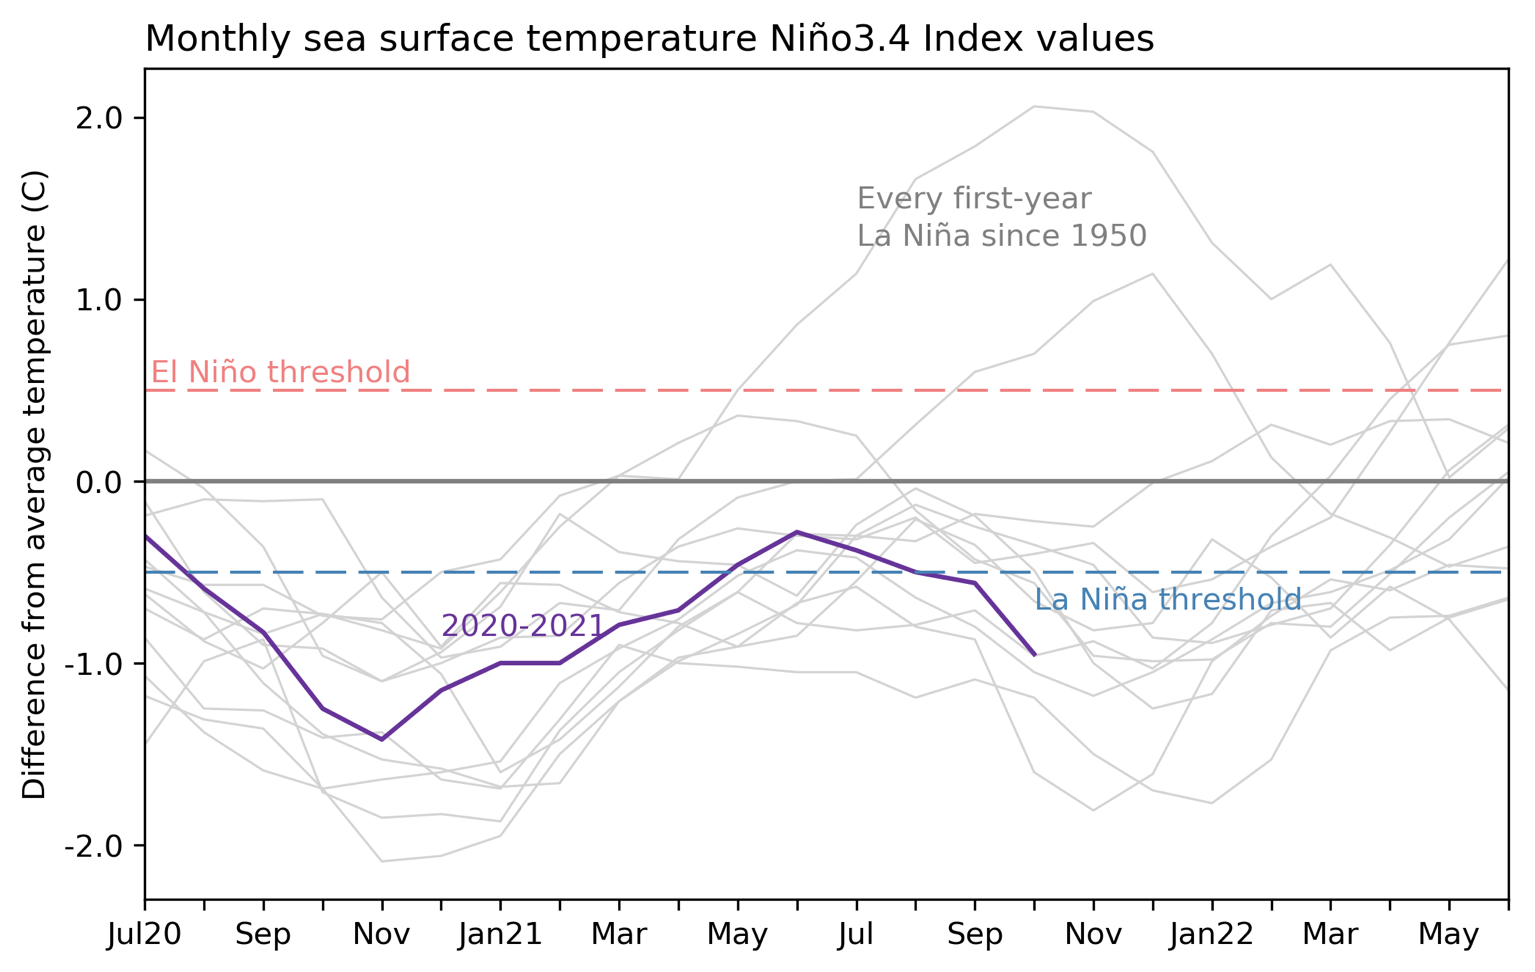 [This graph shows monthly sea surface temperature anomalies (difference from average) in the Niño 3.4 region of the tropical Pacific for 2020-21 (purple line) and all other years (gray lines) starting from first-year La Niña winters since 1950. While two La Niña winters in a row is pretty common, three-peats have occurred only twice. Climate.gov graph based on ERSSTv5 temperature data.]
October featured La Niña’s atmospheric conditions—more rain than average over Indonesia, less over the central Pacific, and stronger-than-average trade winds over portions of the equatorial Pacific. As in all relationships, there are ups and downs, and these patterns were a bit weaker in October than September. However, these two crazy kids are working on their relationship already, with a batch of stronger trade winds currently taking over much of the tropical Pacific.
[This graph shows monthly sea surface temperature anomalies (difference from average) in the Niño 3.4 region of the tropical Pacific for 2020-21 (purple line) and all other years (gray lines) starting from first-year La Niña winters since 1950. While two La Niña winters in a row is pretty common, three-peats have occurred only twice. Climate.gov graph based on ERSSTv5 temperature data.]
October featured La Niña’s atmospheric conditions—more rain than average over Indonesia, less over the central Pacific, and stronger-than-average trade winds over portions of the equatorial Pacific. As in all relationships, there are ups and downs, and these patterns were a bit weaker in October than September. However, these two crazy kids are working on their relationship already, with a batch of stronger trade winds currently taking over much of the tropical Pacific.
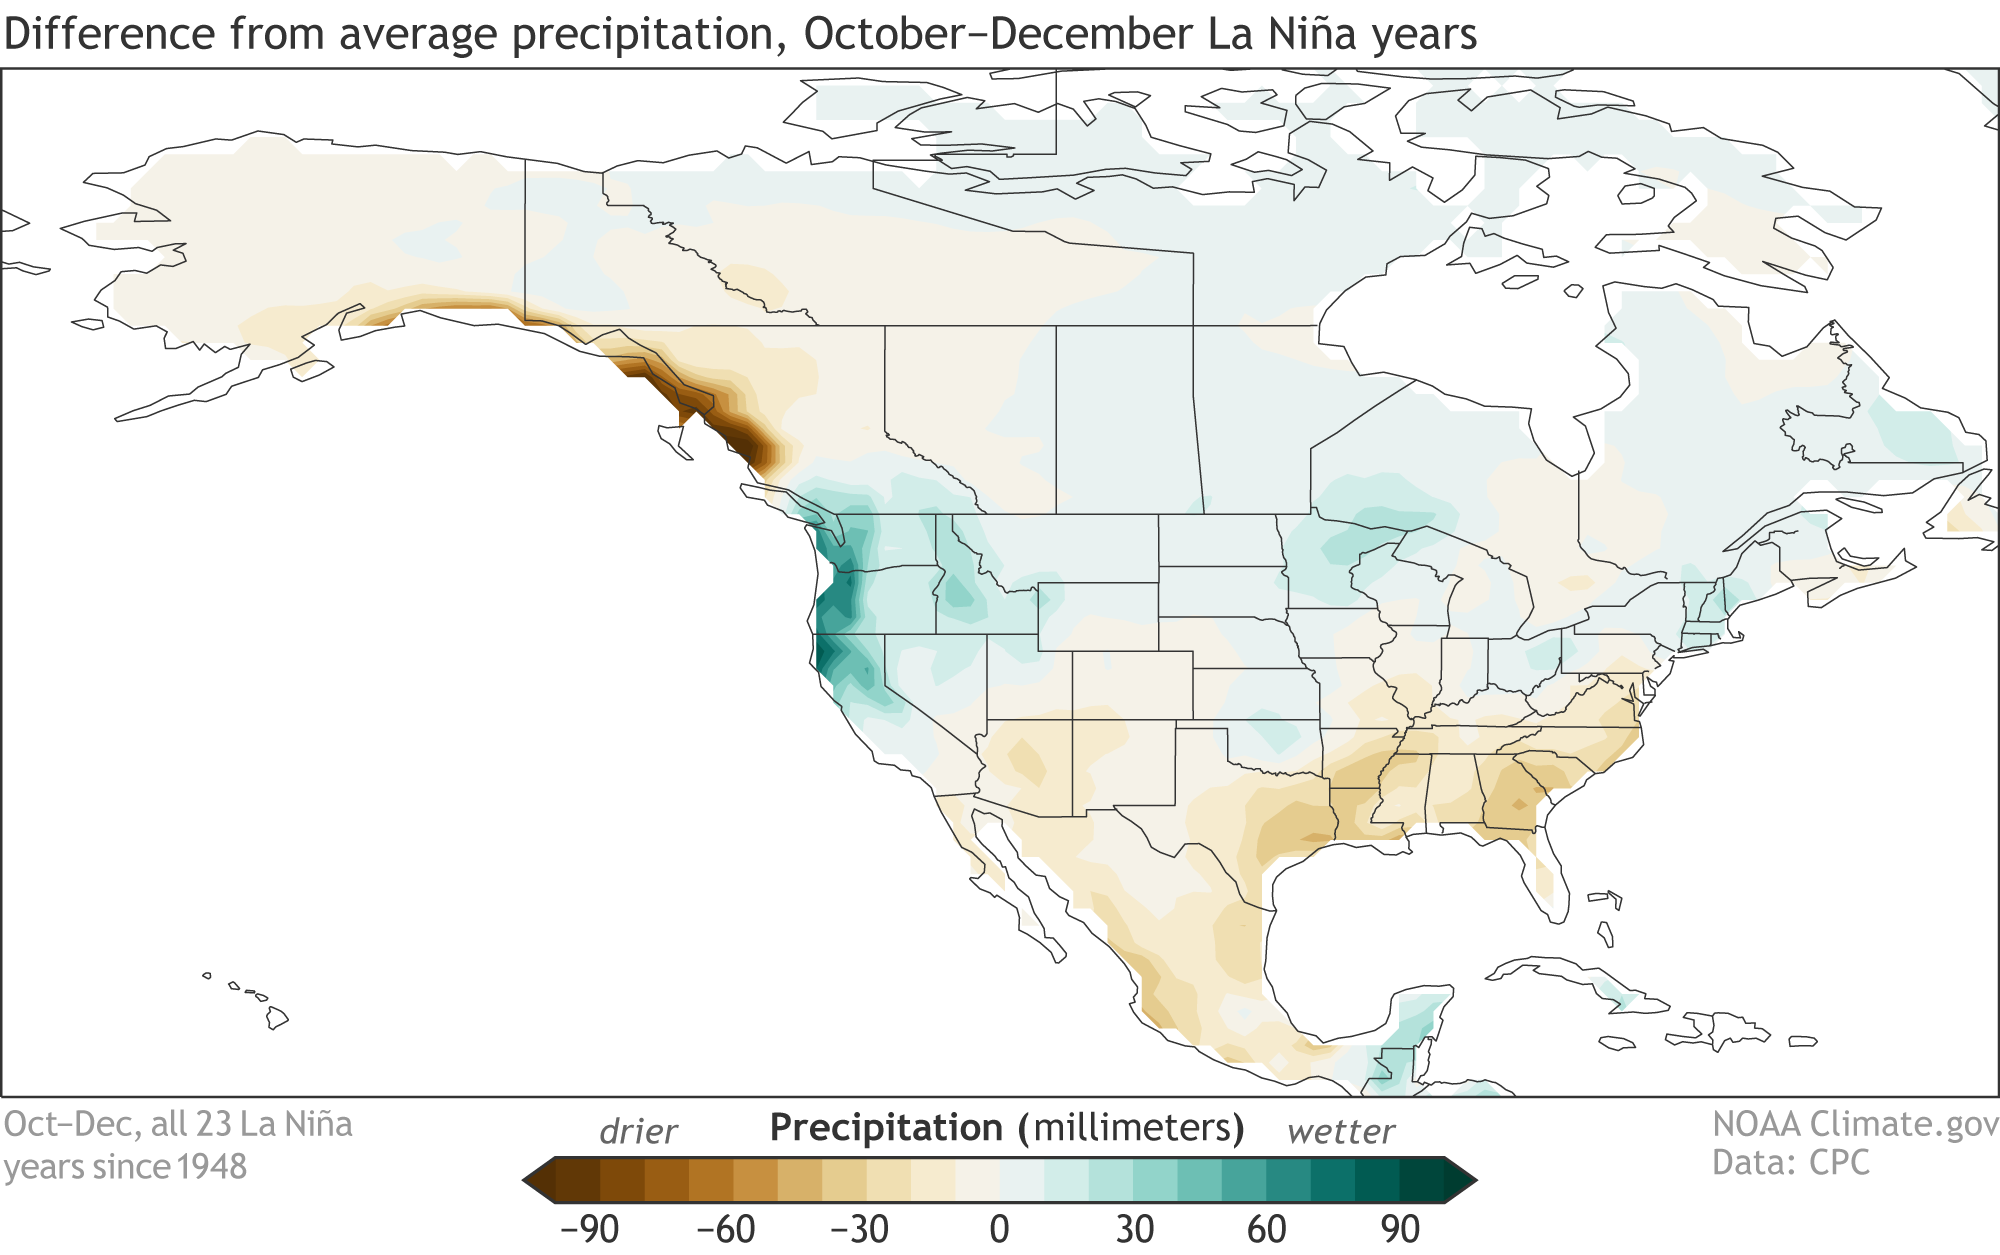 [Composite of October–December precipitation during the 23 La Niña years since 1950, compared to the 1950–2020 average. Composites for other seasons and temperature are available here. NOAA Climate image from CPC data.]
While La Niña tends to be linked to dry conditions and drought through California and the Southwest, that pattern usually develops in December–February through the early spring. You can step through the seasons to see ENSO impacts here. The strong atmospheric river that brought so much rain and snow to northern California last month was not atypical for a La Niña autumn. Overall, the October and early November North American rainfall map looked a lot like what we might expect this time of year during La Niña.
[Composite of October–December precipitation during the 23 La Niña years since 1950, compared to the 1950–2020 average. Composites for other seasons and temperature are available here. NOAA Climate image from CPC data.]
While La Niña tends to be linked to dry conditions and drought through California and the Southwest, that pattern usually develops in December–February through the early spring. You can step through the seasons to see ENSO impacts here. The strong atmospheric river that brought so much rain and snow to northern California last month was not atypical for a La Niña autumn. Overall, the October and early November North American rainfall map looked a lot like what we might expect this time of year during La Niña.
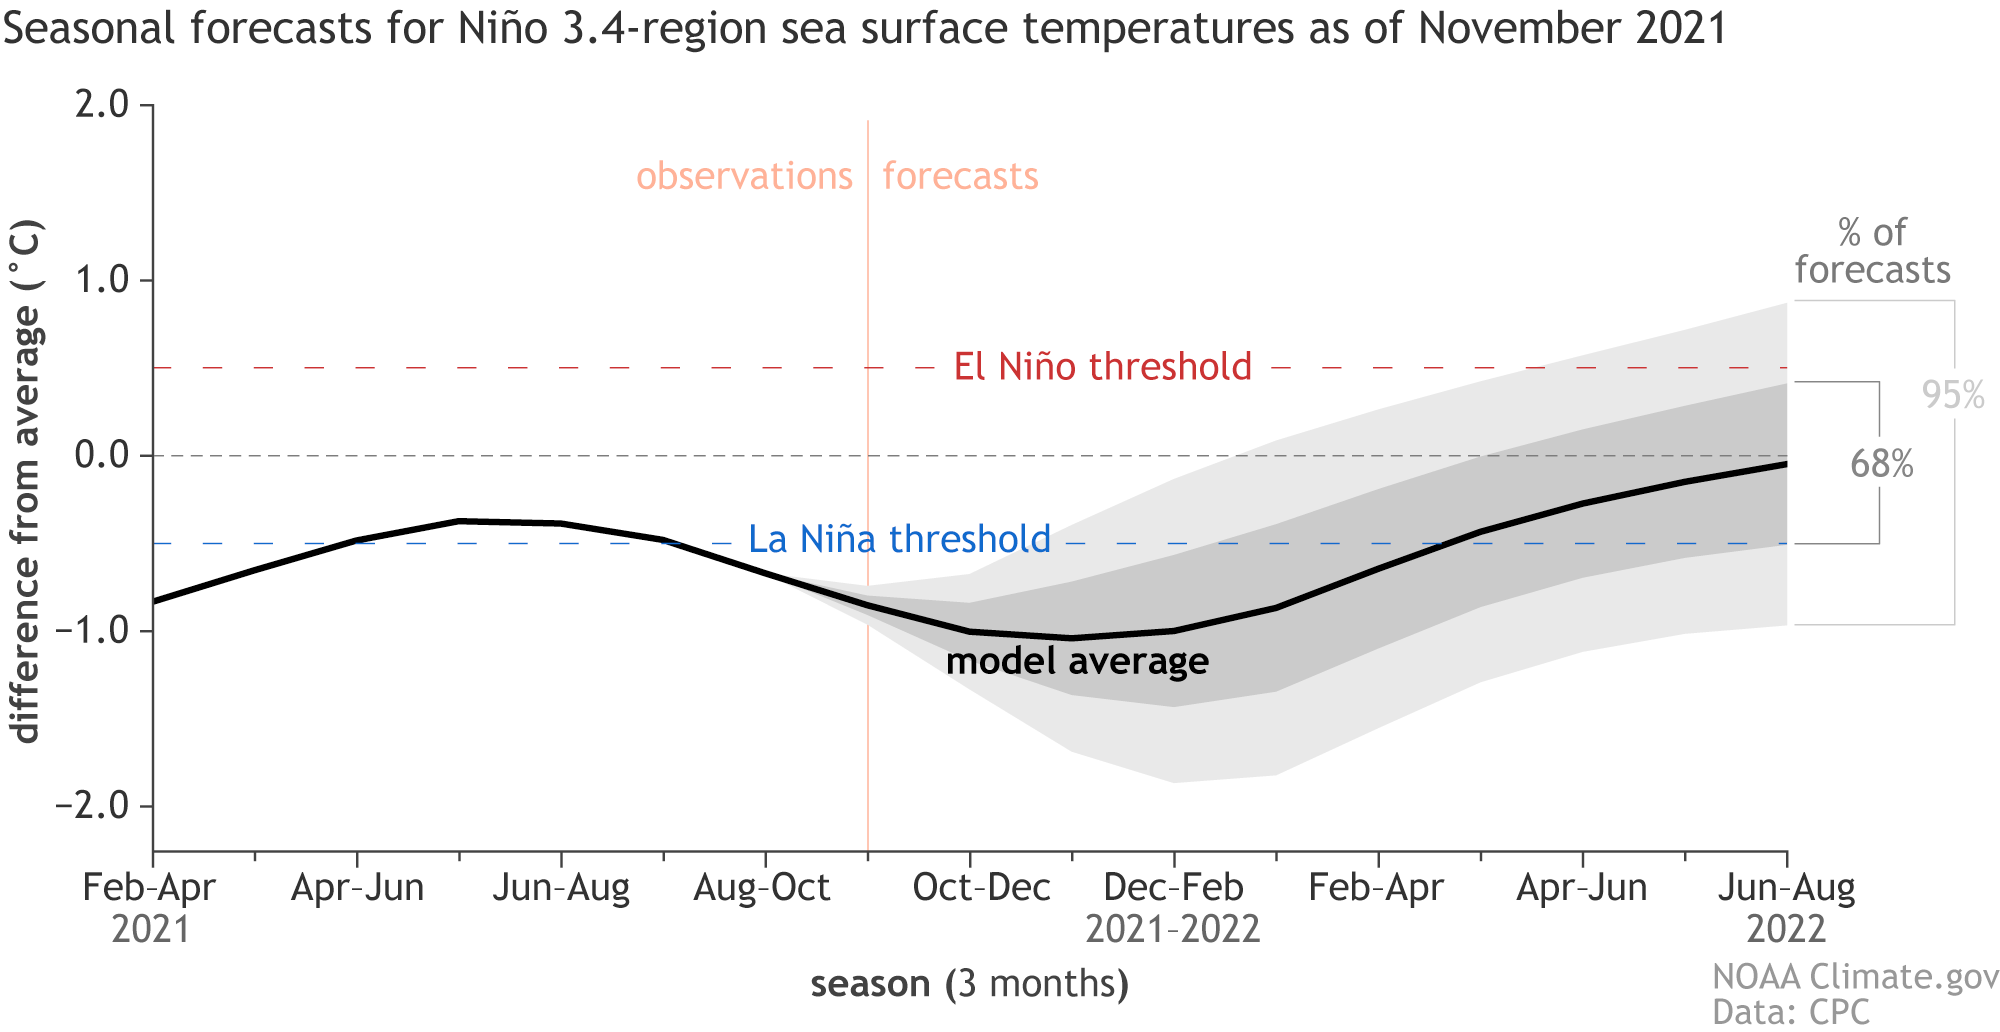 [Climate model forecasts for the Niño3.4 temperature anomalies in late 2021 and 2022 . Average dynamical model data (black line) from the North American Multi-Model Ensemble (NMME): darker gray envelope shows the range of 68% of all model forecasts; lighter gray shows the range of 95% of all model forecasts. Most of the plume—that is, most of the model runs—stay beneath the La Niña threshold this winter. NOAA Climate.gov image from University of Miami data.]
Will this La Niña, already a sequel itself, end up part of a trilogy? Three La Niña winters in a row isn’t unprecedented—that happened in 1973–1976, and 1998–2001—but it is relatively unusual. We will have a better idea by the late spring about what may happen with ENSO in 2022–2023.
Getting back to our current event, there’s about a 2-in-3 chance that this La Niña will be at least moderate in strength, meaning the peak Oceanic Niño Index (the 3-month-average Niño-3.4 anomaly) will be greater than 1.0°C cooler than average. The stronger the ENSO event, the more predictable the weather and climate impacts. More info about how we forecast the strength of an El Niño or La Niña event here.
Edited for WeatherNation by Mace Michaels
[Climate model forecasts for the Niño3.4 temperature anomalies in late 2021 and 2022 . Average dynamical model data (black line) from the North American Multi-Model Ensemble (NMME): darker gray envelope shows the range of 68% of all model forecasts; lighter gray shows the range of 95% of all model forecasts. Most of the plume—that is, most of the model runs—stay beneath the La Niña threshold this winter. NOAA Climate.gov image from University of Miami data.]
Will this La Niña, already a sequel itself, end up part of a trilogy? Three La Niña winters in a row isn’t unprecedented—that happened in 1973–1976, and 1998–2001—but it is relatively unusual. We will have a better idea by the late spring about what may happen with ENSO in 2022–2023.
Getting back to our current event, there’s about a 2-in-3 chance that this La Niña will be at least moderate in strength, meaning the peak Oceanic Niño Index (the 3-month-average Niño-3.4 anomaly) will be greater than 1.0°C cooler than average. The stronger the ENSO event, the more predictable the weather and climate impacts. More info about how we forecast the strength of an El Niño or La Niña event here.
Edited for WeatherNation by Mace Michaels
[This graph shows monthly sea surface temperature anomalies (difference from average) in the Niño 3.4 region of the tropical Pacific for 2020-21 (purple line) and all other years (gray lines) starting from first-year La Niña winters since 1950. While two La Niña winters in a row is pretty common, three-peats have occurred only twice. Climate.gov graph based on ERSSTv5 temperature data.]
October featured La Niña’s atmospheric conditions—more rain than average over Indonesia, less over the central Pacific, and stronger-than-average trade winds over portions of the equatorial Pacific. As in all relationships, there are ups and downs, and these patterns were a bit weaker in October than September. However, these two crazy kids are working on their relationship already, with a batch of stronger trade winds currently taking over much of the tropical Pacific.
Action-adventure
“Predictable” isn’t high praise for a movie plot, but certainly is when it comes to the weather and climate. La Niña-related changes to global atmospheric circulation, including its effect on the jet stream, give us a picture of the average weather conditions expected over the next several months. To be clear, we mean the overall average, not that every day will exhibit the same weather! There have been 23 La Niña events (24 counting this one!) in our historical record, which goes back to 1948. If we look at the October–December rainfall patterns during those La Niñas, we find more rain than average in northern California and the Pacific Northwest, and less than average through the Gulf coast and Southeast.[Composite of October–December precipitation during the 23 La Niña years since 1950, compared to the 1950–2020 average. Composites for other seasons and temperature are available here. NOAA Climate image from CPC data.]
While La Niña tends to be linked to dry conditions and drought through California and the Southwest, that pattern usually develops in December–February through the early spring. You can step through the seasons to see ENSO impacts here. The strong atmospheric river that brought so much rain and snow to northern California last month was not atypical for a La Niña autumn. Overall, the October and early November North American rainfall map looked a lot like what we might expect this time of year during La Niña.
Documentary feature
Spoiler alert! There’s about a 50% chance that La Niña will last into spring 2022 (March–May).
[Climate model forecasts for the Niño3.4 temperature anomalies in late 2021 and 2022 . Average dynamical model data (black line) from the North American Multi-Model Ensemble (NMME): darker gray envelope shows the range of 68% of all model forecasts; lighter gray shows the range of 95% of all model forecasts. Most of the plume—that is, most of the model runs—stay beneath the La Niña threshold this winter. NOAA Climate.gov image from University of Miami data.]
Will this La Niña, already a sequel itself, end up part of a trilogy? Three La Niña winters in a row isn’t unprecedented—that happened in 1973–1976, and 1998–2001—but it is relatively unusual. We will have a better idea by the late spring about what may happen with ENSO in 2022–2023.
Getting back to our current event, there’s about a 2-in-3 chance that this La Niña will be at least moderate in strength, meaning the peak Oceanic Niño Index (the 3-month-average Niño-3.4 anomaly) will be greater than 1.0°C cooler than average. The stronger the ENSO event, the more predictable the weather and climate impacts. More info about how we forecast the strength of an El Niño or La Niña event here.
Edited for WeatherNation by Mace Michaels
All Weather News
More
Heavy Rain Returns to Texas This Weekend
It's been a week since the devastating floods
12 Jul 2025 3:10 AM

Medium Range Tropics Forecast Favors Gulf, CSU Updates Seasonal Forecast
While the Atlantic appears quiet, conditions
12 Jul 2025 3:05 AM

Elevated Tornado Risk Targets the Midwest Friday
Friday was another busy day with severe weath
12 Jul 2025 3:00 AM

Storms Return From the Front Range to Texas
Moisture is moving back into the Central and
12 Jul 2025 2:50 AM

Timeline: How Catastrophic Flooding Unfolded in Texas Hill Country
TEXAS - Catastrophic flooding devastated port
11 Jul 2025 10:00 AM

Severe Thunderstorms Expected Across the East Coast
The severe weather and flood threat continues
11 Jul 2025 2:35 AM

Ruidoso Flash Flooding - Record Crest for the Rio Ruidoso River
A slow-moving monsoonal thunderstorm develope
10 Jul 2025 1:55 AM