Tracking Florida’s Red Tides with Satellites and Smartphones
Special Stories
4 Sep 2018 9:18 AM
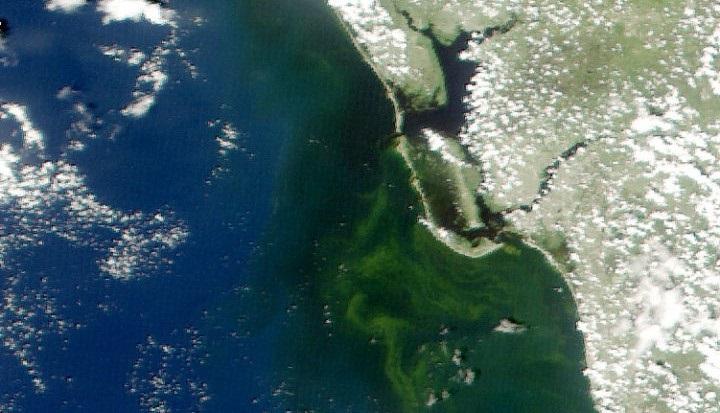
[Natural-color MODIS satellite image of algae staining the water off the coast of Fort Myers on August 19. Image from the University of South Florida Near Real-Time Integrated Red tide Information System (IRIS).]
From NASA
Put a sample of water from the Gulf of Mexico under a microscope, and you will often find cells of Karenia brevis swimming around. The microscopic algae—the species of phytoplankton responsible for Florida’s worst red tide outbreaks—produce brevetoxin, a compound that in high concentrations can kill wildlife and cause neurological, respiratory, and gastrointestinal issues for people.
Under normal conditions, water quality tests find, at most, a few hundred K. brevis cells per liter of water—not enough to cause problems. But in August 2018, in the midst of one of the most severe red tide outbreaks to hit Florida’s Gulf Coast in a decade, water samples regularly contained more than one million K. brevis cells per liter.
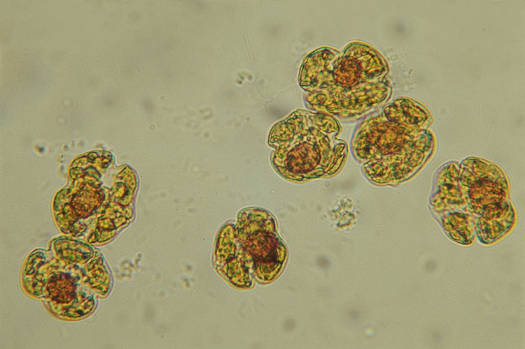 [Karenia brevis cells. Image credit: Mote Marine Laboratory]
That was enough to stain large swaths of coastal waters shades of green and brownish-red and leave beaches littered with rotting fish carcasses. Roughly 100 manatees, more than 200 sea turtles, and at least 12 dolphins have been killled by red tides, according to preliminary estimates. For much of August, the toxic bloom stretched about 130 miles (200 kilometers) along Florida’s Gulf coast, from roughly Tampa to Fort Myers. Though the bloom has been active since October 2017, it intensified rapidly in July 2018. The damage grew so severe and widespread that Florida’s governor declared a state of emergency in mid-August.
One of the best ways to test for the presence of K. brevis is to analyze water samples collected from boats or beaches. State environmental agencies do this on a regular basis, but understanding the full extent and evolution of fast-changing blooms, or predicting where they will move with ground sampling alone is a challenge.
[Karenia brevis cells. Image credit: Mote Marine Laboratory]
That was enough to stain large swaths of coastal waters shades of green and brownish-red and leave beaches littered with rotting fish carcasses. Roughly 100 manatees, more than 200 sea turtles, and at least 12 dolphins have been killled by red tides, according to preliminary estimates. For much of August, the toxic bloom stretched about 130 miles (200 kilometers) along Florida’s Gulf coast, from roughly Tampa to Fort Myers. Though the bloom has been active since October 2017, it intensified rapidly in July 2018. The damage grew so severe and widespread that Florida’s governor declared a state of emergency in mid-August.
One of the best ways to test for the presence of K. brevis is to analyze water samples collected from boats or beaches. State environmental agencies do this on a regular basis, but understanding the full extent and evolution of fast-changing blooms, or predicting where they will move with ground sampling alone is a challenge.
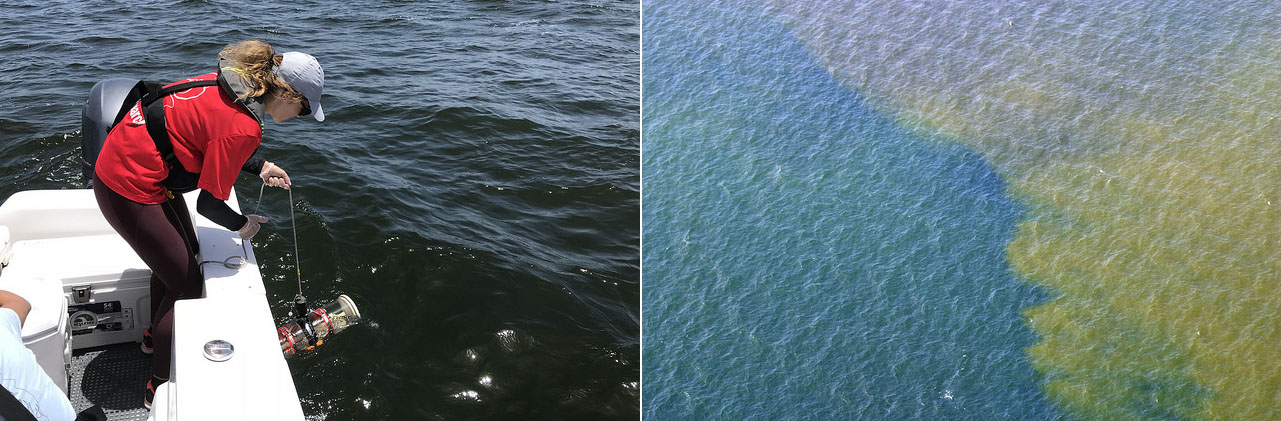 [Sampling red tide in 2018 (left). An aerial view of red tide in 2005 (right). Photo credits: Florida Fish and Wildlife Conservation Commission]
That’s why key red tide monitoring systems, such as the National Oceanic and Atmospheric Administration’s (NOAA’s) Harmful Algal Bloom Forecast System and the Near Real-Time Integrated Red Tide Information System (IRIS) from the University of South Florida, make use of satellite data from the Moderate Resolution Imaging Spectroradiometer (MODIS) sensors on NASA’s Aqua and Terra satellites. These sensors pass over Florida’s Gulf Coast twice a day, acquiring data at several wavelengths that can be useful for identifying and mapping the spatial extent of algal blooms. Other satellite sensors such as the Visible Infrared Imaging Radiometer Suite (VIIRS) on Suomi NPP and the Ocean and Land Color Instrument (OCLI) on Sentinel-3 collect information that can be used to monitor red tides as well.
Despite the utility of satellite observations, there are some significant challenges to interpreting satellite data of algal blooms in shallow, coastal waters, explained oceanographer Chuanmin Hu of the University of South Florida. Chief among them: it can be quite difficult to distinguish between algal blooms, suspended sediment, and colored dissolved organic matter (CDOM) that flows into coastal areas.
[Sampling red tide in 2018 (left). An aerial view of red tide in 2005 (right). Photo credits: Florida Fish and Wildlife Conservation Commission]
That’s why key red tide monitoring systems, such as the National Oceanic and Atmospheric Administration’s (NOAA’s) Harmful Algal Bloom Forecast System and the Near Real-Time Integrated Red Tide Information System (IRIS) from the University of South Florida, make use of satellite data from the Moderate Resolution Imaging Spectroradiometer (MODIS) sensors on NASA’s Aqua and Terra satellites. These sensors pass over Florida’s Gulf Coast twice a day, acquiring data at several wavelengths that can be useful for identifying and mapping the spatial extent of algal blooms. Other satellite sensors such as the Visible Infrared Imaging Radiometer Suite (VIIRS) on Suomi NPP and the Ocean and Land Color Instrument (OCLI) on Sentinel-3 collect information that can be used to monitor red tides as well.
Despite the utility of satellite observations, there are some significant challenges to interpreting satellite data of algal blooms in shallow, coastal waters, explained oceanographer Chuanmin Hu of the University of South Florida. Chief among them: it can be quite difficult to distinguish between algal blooms, suspended sediment, and colored dissolved organic matter (CDOM) that flows into coastal areas.
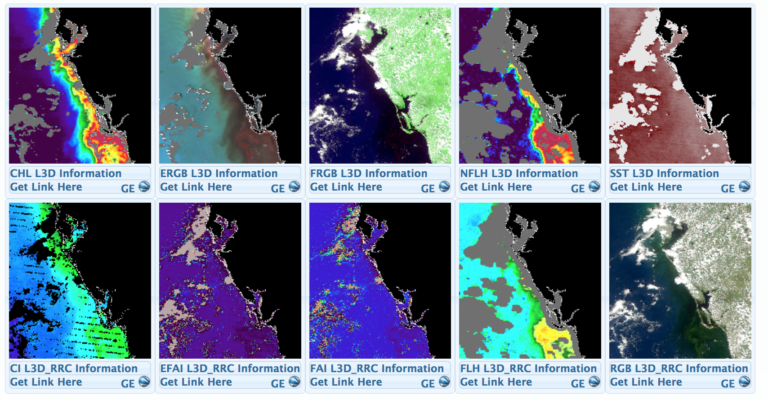 [A screenshot from the University of South Florida’s Near Real-Time Integrated Red tide Information System (IRIS). The image shows various types of data captured by MODIS sensor on Terra on August 19, 2018. Solar-stimulated fluorescence data (NFLH) is particularly useful for locating algal blooms. Image Credit: USF/IRIS]
To get around this problem and make satellites better at pinpointing algal blooms, Hu and colleagues at the University of South Florida have developed a red tide monitoring system that makes use of MODIS observations of fluorescence, which algal bloom emit in response to exposure to sunlight. “If we have fluorescence data to go along with a natural-color image from MODIS, we can say with a high degree of confidence where the algal blooms are and where the sensor is just detecting sediment or CDOM,” he said. When fluorescence data is available, the Florida Fish and Wildlife Commission pushes it out to the public as part of its red tide status updates (see the August 21 update below).
Likewise, NOAA has combined a fluorescence method with a long-standing technique that identifies recent increases in chlorophyll concentration, the combination improves the identification of likely K. brevis blooms — information that then gets incorporated in NOAA’s HAB Forecast System, noted Richard Stumpf, an oceanographer with NOAA.
[A screenshot from the University of South Florida’s Near Real-Time Integrated Red tide Information System (IRIS). The image shows various types of data captured by MODIS sensor on Terra on August 19, 2018. Solar-stimulated fluorescence data (NFLH) is particularly useful for locating algal blooms. Image Credit: USF/IRIS]
To get around this problem and make satellites better at pinpointing algal blooms, Hu and colleagues at the University of South Florida have developed a red tide monitoring system that makes use of MODIS observations of fluorescence, which algal bloom emit in response to exposure to sunlight. “If we have fluorescence data to go along with a natural-color image from MODIS, we can say with a high degree of confidence where the algal blooms are and where the sensor is just detecting sediment or CDOM,” he said. When fluorescence data is available, the Florida Fish and Wildlife Commission pushes it out to the public as part of its red tide status updates (see the August 21 update below).
Likewise, NOAA has combined a fluorescence method with a long-standing technique that identifies recent increases in chlorophyll concentration, the combination improves the identification of likely K. brevis blooms — information that then gets incorporated in NOAA’s HAB Forecast System, noted Richard Stumpf, an oceanographer with NOAA.
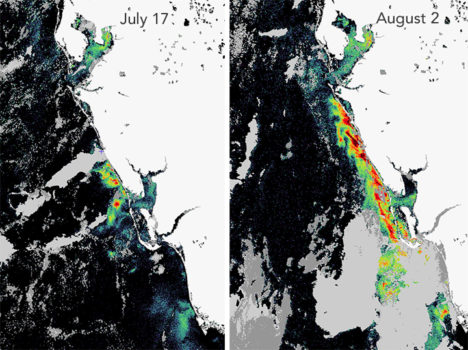 [The Karenia brevis bloom expanded and intensified in late-July. This fluorescence data comes from the OCLI sensor on Sentinel 3. Image courtesy of Rick Stumpf, NOAA.]
However, that still leaves some big problems—only about ten percent of MODIS passes collect usable fluorescence data. The rest of the time images are marred by either sunglint or clouds. And the algorithm that scientists use to detect algal blooms with MODIS does not work well within one kilometer of the coast—the part that is of the greatest interest to beachgoers and boaters.
To help fill in the gaps, NASA’s Applied Science program is working with several partner institutions on a smartphone app called HABscope. The app, developed by Gulf of Mexico Observing System(GCOOS) researcher Robert Currier, makes it possible for trained water samplers (typically lifeguards who participate in Mote Marine Laboratory’s Beach Conditions Reporting System) to collect video of water using microscopes attached to their smartphones.
[The Karenia brevis bloom expanded and intensified in late-July. This fluorescence data comes from the OCLI sensor on Sentinel 3. Image courtesy of Rick Stumpf, NOAA.]
However, that still leaves some big problems—only about ten percent of MODIS passes collect usable fluorescence data. The rest of the time images are marred by either sunglint or clouds. And the algorithm that scientists use to detect algal blooms with MODIS does not work well within one kilometer of the coast—the part that is of the greatest interest to beachgoers and boaters.
To help fill in the gaps, NASA’s Applied Science program is working with several partner institutions on a smartphone app called HABscope. The app, developed by Gulf of Mexico Observing System(GCOOS) researcher Robert Currier, makes it possible for trained water samplers (typically lifeguards who participate in Mote Marine Laboratory’s Beach Conditions Reporting System) to collect video of water using microscopes attached to their smartphones.
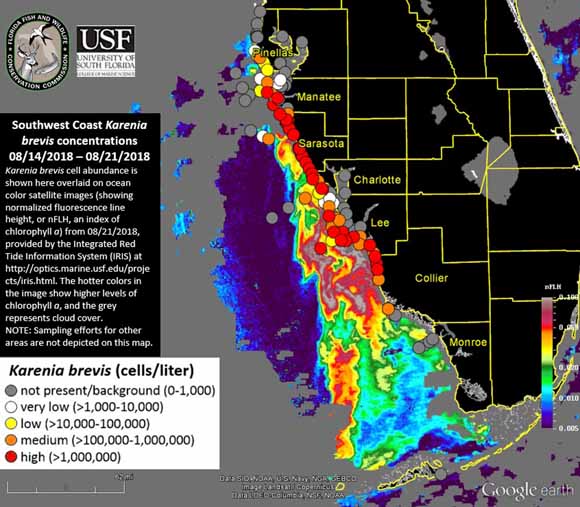 [K. brevis cell abundance shown on an ocean color satellite image from the IRIS system. Warmer colors indicate higher levels of chlorophyll a, an indicator of algae. Cloudy areas are gray. Circles indicate locations where officials tested water samples on the ground. Image Credit: FFW/USF/IRIS.]
After recording, HABscope uploads videos to a cloud-based server for automatic analysis by computer software. The software rapidly counts the number of K. brevis cells in a water sample by using technology similar to that found in facial recognition apps. But rather than focusing on facial features, the software looks for a particular pattern in the movement of K. breviscells.
K. brevis are vigorous swimmers, often using a pair of long, whip-like flagella to migrate vertically about 10 to 20 meters (33 to 66 feet) each day. They chart a zig-zagging, corkscrew-shaped path that allows the software to easily pick them out amidst the cast of other phytoplankton found in Gulf of Mexico water samples.
https://www.youtube.com/watch?v=139jihWRWuU
The data about K. brevis abundance at various locations along the coast is then fed into a respiratory distress forecasting tool managed by NOAA. “Respiratory distress forecasts can now be produced 1 to 2 times per day for specific beaches along the Florida Gulf Coast,” said Stumpf. “Previous to this project, these forecasts were issued at most twice a week, and only as general statements about risk within a county. The combination of earth observations with rapid field monitoring will increase the accuracy and usefulness of the forecasts.”
Edited for WeatherNation by Meteorologist Mace Michaels
[K. brevis cell abundance shown on an ocean color satellite image from the IRIS system. Warmer colors indicate higher levels of chlorophyll a, an indicator of algae. Cloudy areas are gray. Circles indicate locations where officials tested water samples on the ground. Image Credit: FFW/USF/IRIS.]
After recording, HABscope uploads videos to a cloud-based server for automatic analysis by computer software. The software rapidly counts the number of K. brevis cells in a water sample by using technology similar to that found in facial recognition apps. But rather than focusing on facial features, the software looks for a particular pattern in the movement of K. breviscells.
K. brevis are vigorous swimmers, often using a pair of long, whip-like flagella to migrate vertically about 10 to 20 meters (33 to 66 feet) each day. They chart a zig-zagging, corkscrew-shaped path that allows the software to easily pick them out amidst the cast of other phytoplankton found in Gulf of Mexico water samples.
https://www.youtube.com/watch?v=139jihWRWuU
The data about K. brevis abundance at various locations along the coast is then fed into a respiratory distress forecasting tool managed by NOAA. “Respiratory distress forecasts can now be produced 1 to 2 times per day for specific beaches along the Florida Gulf Coast,” said Stumpf. “Previous to this project, these forecasts were issued at most twice a week, and only as general statements about risk within a county. The combination of earth observations with rapid field monitoring will increase the accuracy and usefulness of the forecasts.”
Edited for WeatherNation by Meteorologist Mace Michaels
[Karenia brevis cells. Image credit: Mote Marine Laboratory]
That was enough to stain large swaths of coastal waters shades of green and brownish-red and leave beaches littered with rotting fish carcasses. Roughly 100 manatees, more than 200 sea turtles, and at least 12 dolphins have been killled by red tides, according to preliminary estimates. For much of August, the toxic bloom stretched about 130 miles (200 kilometers) along Florida’s Gulf coast, from roughly Tampa to Fort Myers. Though the bloom has been active since October 2017, it intensified rapidly in July 2018. The damage grew so severe and widespread that Florida’s governor declared a state of emergency in mid-August.
One of the best ways to test for the presence of K. brevis is to analyze water samples collected from boats or beaches. State environmental agencies do this on a regular basis, but understanding the full extent and evolution of fast-changing blooms, or predicting where they will move with ground sampling alone is a challenge.
[Sampling red tide in 2018 (left). An aerial view of red tide in 2005 (right). Photo credits: Florida Fish and Wildlife Conservation Commission]
That’s why key red tide monitoring systems, such as the National Oceanic and Atmospheric Administration’s (NOAA’s) Harmful Algal Bloom Forecast System and the Near Real-Time Integrated Red Tide Information System (IRIS) from the University of South Florida, make use of satellite data from the Moderate Resolution Imaging Spectroradiometer (MODIS) sensors on NASA’s Aqua and Terra satellites. These sensors pass over Florida’s Gulf Coast twice a day, acquiring data at several wavelengths that can be useful for identifying and mapping the spatial extent of algal blooms. Other satellite sensors such as the Visible Infrared Imaging Radiometer Suite (VIIRS) on Suomi NPP and the Ocean and Land Color Instrument (OCLI) on Sentinel-3 collect information that can be used to monitor red tides as well.
Despite the utility of satellite observations, there are some significant challenges to interpreting satellite data of algal blooms in shallow, coastal waters, explained oceanographer Chuanmin Hu of the University of South Florida. Chief among them: it can be quite difficult to distinguish between algal blooms, suspended sediment, and colored dissolved organic matter (CDOM) that flows into coastal areas.
[A screenshot from the University of South Florida’s Near Real-Time Integrated Red tide Information System (IRIS). The image shows various types of data captured by MODIS sensor on Terra on August 19, 2018. Solar-stimulated fluorescence data (NFLH) is particularly useful for locating algal blooms. Image Credit: USF/IRIS]
To get around this problem and make satellites better at pinpointing algal blooms, Hu and colleagues at the University of South Florida have developed a red tide monitoring system that makes use of MODIS observations of fluorescence, which algal bloom emit in response to exposure to sunlight. “If we have fluorescence data to go along with a natural-color image from MODIS, we can say with a high degree of confidence where the algal blooms are and where the sensor is just detecting sediment or CDOM,” he said. When fluorescence data is available, the Florida Fish and Wildlife Commission pushes it out to the public as part of its red tide status updates (see the August 21 update below).
Likewise, NOAA has combined a fluorescence method with a long-standing technique that identifies recent increases in chlorophyll concentration, the combination improves the identification of likely K. brevis blooms — information that then gets incorporated in NOAA’s HAB Forecast System, noted Richard Stumpf, an oceanographer with NOAA.
[The Karenia brevis bloom expanded and intensified in late-July. This fluorescence data comes from the OCLI sensor on Sentinel 3. Image courtesy of Rick Stumpf, NOAA.]
However, that still leaves some big problems—only about ten percent of MODIS passes collect usable fluorescence data. The rest of the time images are marred by either sunglint or clouds. And the algorithm that scientists use to detect algal blooms with MODIS does not work well within one kilometer of the coast—the part that is of the greatest interest to beachgoers and boaters.
To help fill in the gaps, NASA’s Applied Science program is working with several partner institutions on a smartphone app called HABscope. The app, developed by Gulf of Mexico Observing System(GCOOS) researcher Robert Currier, makes it possible for trained water samplers (typically lifeguards who participate in Mote Marine Laboratory’s Beach Conditions Reporting System) to collect video of water using microscopes attached to their smartphones.
[K. brevis cell abundance shown on an ocean color satellite image from the IRIS system. Warmer colors indicate higher levels of chlorophyll a, an indicator of algae. Cloudy areas are gray. Circles indicate locations where officials tested water samples on the ground. Image Credit: FFW/USF/IRIS.]
After recording, HABscope uploads videos to a cloud-based server for automatic analysis by computer software. The software rapidly counts the number of K. brevis cells in a water sample by using technology similar to that found in facial recognition apps. But rather than focusing on facial features, the software looks for a particular pattern in the movement of K. breviscells.
K. brevis are vigorous swimmers, often using a pair of long, whip-like flagella to migrate vertically about 10 to 20 meters (33 to 66 feet) each day. They chart a zig-zagging, corkscrew-shaped path that allows the software to easily pick them out amidst the cast of other phytoplankton found in Gulf of Mexico water samples.
https://www.youtube.com/watch?v=139jihWRWuU
The data about K. brevis abundance at various locations along the coast is then fed into a respiratory distress forecasting tool managed by NOAA. “Respiratory distress forecasts can now be produced 1 to 2 times per day for specific beaches along the Florida Gulf Coast,” said Stumpf. “Previous to this project, these forecasts were issued at most twice a week, and only as general statements about risk within a county. The combination of earth observations with rapid field monitoring will increase the accuracy and usefulness of the forecasts.”
Edited for WeatherNation by Meteorologist Mace MichaelsAll Weather News
More
Severe Storms Repeat Daily Across the Plains
The plains has been active over the last seve
7 Jun 2026 1:20 PM

Tropical Moisture Brings Increased Flood Risk to the Gulf Coast This Weekend
A broad area of tropical moisture moving acro
7 Jun 2026 1:10 PM

Two Disturbances in the Eastern Pacific Have a Chance of Developing
It's Hurricane Prep Week on WeatherNation for
7 Jun 2026 12:50 PM


Severe Storms, Flash Flooding Threaten Millions Across the Plains This Weekend
Millions of people across the Plains are unde
7 Jun 2026 1:55 AM

Severe Storms for the Northeast This Weekend
The Storm Prediction Center has issued a seve
7 Jun 2026 1:50 AM

Severe Storms Target the Midwest Overnight
Strong storms have been surging across the Pl
6 Jun 2026 2:20 AM