Using El Nino to Predict King Tides
Special Stories
23 Aug 2018 8:09 AM
[Coconut Grove, Florida during King Tide, 2015. Photo by Thomas Ruppert, courtesy of Florida Sea Grant via CC license.]
From NOAA by Benjamin Kirtman
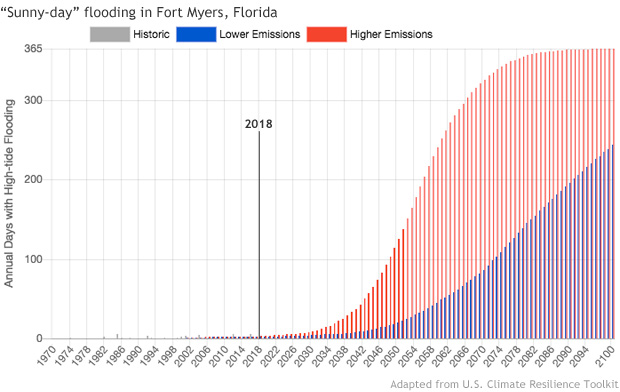 [Grey bars from 1950 to 2016 show observed annual counts of high tide flooding. Red and blue bars show the average number of high tide flooding events projected for the future years depending on two possible pathways for future greenhouse gas emissions. Image adapted from the U.S. Climate Resilience Toolkit.]
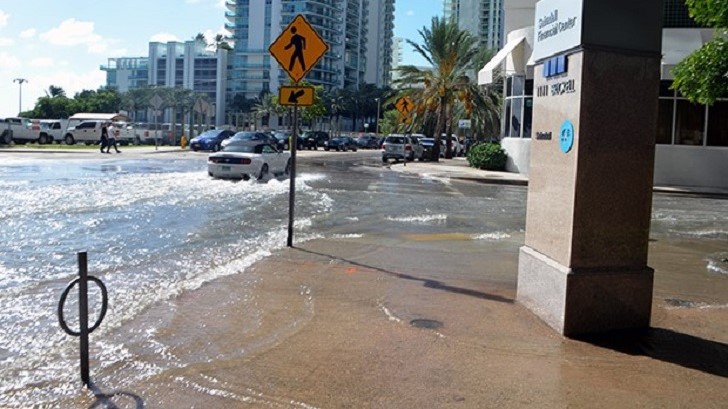 [Sunny day tidal flooding on October,17 2016 at Brickell Bay Drive and 12th Street in downtown Miami. Photo by wikimedia user B137 via CC license.]
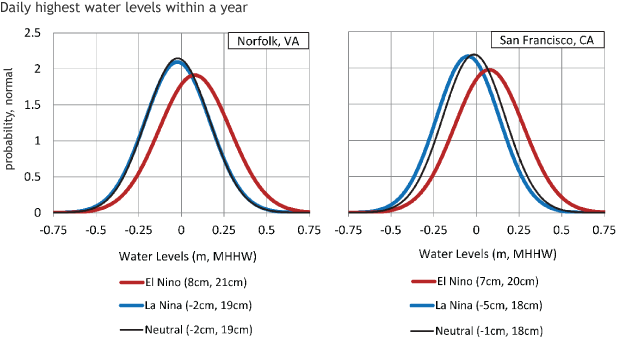 [Parametric probability distribution (normal) fit for 3 years characterized by stronger El Niño, stronger La Niña and ENSO-neutral conditions. In parentheses are the mean and standard deviation (or square of the variance) of the distributions shown in the figures. Water levels have been detrended to enable multi-year comparisons. Not shown are the 95% confidence intervals for the distribution parameters which suggest a significant change of conditions during El Niño along both of these (and other) West and East Coast locations. Image is provided within NOAA Technical Report NOS CO-OPS 086.]
This approach is similar to making a seasonal hurricane outlook. Just a couple weeks ago NOAA issued its updated Atlantic seasonal hurricane outlook calling for a below or near normal season with 9-13 named storms. This reduction is partially due to forecasts of a potential El Niño and below-average ocean temperatures in a key region of the Atlantic Ocean. The outlook can’t say anything about the timing, track or intensity of a specific storm though. But it can give an overall broad picture of what to expect.
Just as in seasonal hurricane outlooks, one source of information for seasonal flood risk is ENSO. The figure above shows the frequency, or probability, of daily highest water levels at Norfolk, Virginia and San Francisco, California (from the NOAA report in Footnote #1). In each panel there are three curves, which we call “probability distributions,” that match up with three states of ENSO: (i) Neutral (i.e., no El Niño or La Niña), (ii) La Niña, and (iii) El Niño. The red curve is significantly shifted to the right of the black/blue curves, showing that El Niño leads to increased chances of higher water levels in both Norfolk and San Francisco (indicated by the values on the horizontal x-axis). (4)
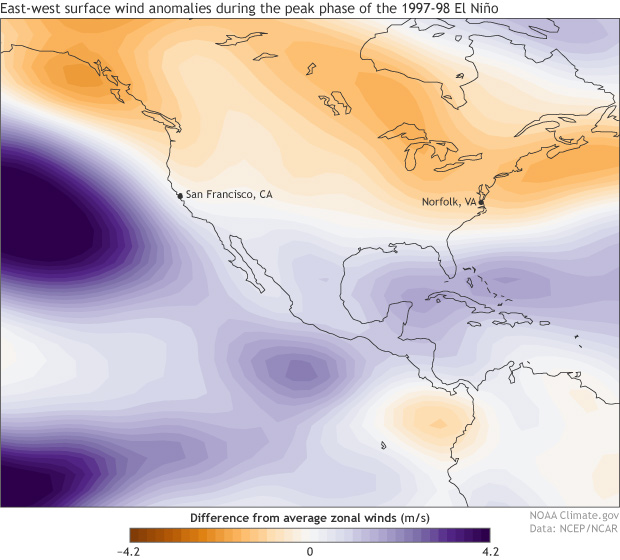 [Surface zonal wind anomalies (in meters per second) during the peak phase (December 1997-February 1998) of the 1997-98 El Niño. The zonal wind data is from the NCEP/NCAR reanalysis project [Kalney et al. (1996), The NCEP/NCAR 40-year reanalysis project. Bull. Am. Met. Soc., 77, 437-471.]. Image is from Ben Kirtman and was modified by NOAA Climate.]
During the El Niño in 1997-98 for instance, surface winds along the Northeast coast were more east-to-west (i.e., more on-shore) and along the Southeast coast they are more west-to-east (i.e., more off-shore). These changes in on-shore vs. off-shore winds are largely consistent with the coastal changes in sea level seen in the figure below. While the illustrations provided are just one case, many of these relationships hold during other El Niño events as well.
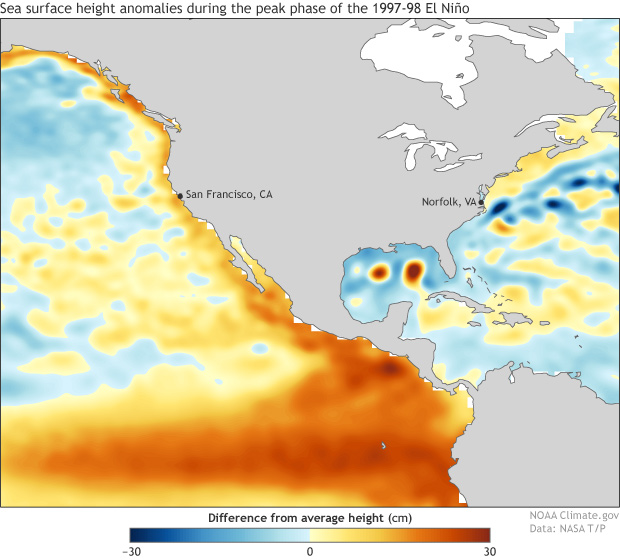 [Sea surface height anomalies during the peak phase (December 1997-February 1998) of the 1997-98 El Niño. The sea surface height (in centimeters) is estimated from TOPEX-POSEIDON altimeter data. Image is from Ben Kirtman and was modified by NOAA climate.]
A Flooded Future
As residents of South Florida, we are confronted with the profound challenge of sea level rise due to our warming climate. The projections of 3 or 6 feet of rise by the year 2100—depending on how rapidly carbon dioxide emissions rise in the coming century—are of serious concern to property owners, local governments, and resource managers, among others. This translates into a risk that “high tide flooding will occur every other day or more often” by 2100 along the entire Atlantic coast (1). If we continue follow an energy pathway with relatively high emissions, many U.S. locations will begin experiencing significant upticks in the number of days per year with high tide flooding within 15-20 years. Remarkably, this flooding would occur without any extreme rainfall associated with, say, thunderstorms or storm surge associated with tropical weather systems or hurricanes. This is often referred to as “clear-sky flooding," sunny-day flooding,” or “nuisance flooding.” [Grey bars from 1950 to 2016 show observed annual counts of high tide flooding. Red and blue bars show the average number of high tide flooding events projected for the future years depending on two possible pathways for future greenhouse gas emissions. Image adapted from the U.S. Climate Resilience Toolkit.]
Coastal Flooding Today
Forget about the future for a second—my friends and neighbors worry about flooding today. They worry about how many times is there going to be street flooding during the next “King-tide” season (2)? Essentially, they want to know a few weeks or a few months in advance whether there is going to be minor, moderate, or major flooding (3), how often it will occur, and how long will it last. Will it be a minor inconvenience, like finding dry parking at the local grocery store? Or will roads be closed, affecting public transit and commute times? Is this the year they need to implement the major drainage improvements on their property that they have been putting off because of costs? Likewise, local governments need early warning systems for tidal flood risk to guarantee that their residents are well informed and well prepared. Does the city of Miami, FL, have access to enough deployable temporary pumping systems to manage the tidal flooding? Sub-seasonal (within a season) to seasonal coastal flood outlooks could certainly help preparedness. [Sunny day tidal flooding on October,17 2016 at Brickell Bay Drive and 12th Street in downtown Miami. Photo by wikimedia user B137 via CC license.]
Predicting Coastal Flooding Seasons in Advance?
While predicting tides is relatively straightforward, predicting flood risk is much more challenging. Tidal flood risk is compounded by extreme rainfall and is also significantly affected by the local winds. For example, winds blowing from the ocean toward the shore (on-shore winds) during an extreme high tide will increase coastal flooding, whereas off-shore winds (winds blowing from the shore toward the ocean) decrease coastal flooding risk. So, knowing the risk of rain and winds in advance can help create a flood risk forecast. However, making such an outlook a few weeks or a few months in advance requires probabilistic forecasts. For example, we cannot predict with certainty that there will be flooding a month from today, but with the knowledge of certain climate drivers, we can potentially predict that the risk of flood is increased. [Parametric probability distribution (normal) fit for 3 years characterized by stronger El Niño, stronger La Niña and ENSO-neutral conditions. In parentheses are the mean and standard deviation (or square of the variance) of the distributions shown in the figures. Water levels have been detrended to enable multi-year comparisons. Not shown are the 95% confidence intervals for the distribution parameters which suggest a significant change of conditions during El Niño along both of these (and other) West and East Coast locations. Image is provided within NOAA Technical Report NOS CO-OPS 086.]
This approach is similar to making a seasonal hurricane outlook. Just a couple weeks ago NOAA issued its updated Atlantic seasonal hurricane outlook calling for a below or near normal season with 9-13 named storms. This reduction is partially due to forecasts of a potential El Niño and below-average ocean temperatures in a key region of the Atlantic Ocean. The outlook can’t say anything about the timing, track or intensity of a specific storm though. But it can give an overall broad picture of what to expect.
Just as in seasonal hurricane outlooks, one source of information for seasonal flood risk is ENSO. The figure above shows the frequency, or probability, of daily highest water levels at Norfolk, Virginia and San Francisco, California (from the NOAA report in Footnote #1). In each panel there are three curves, which we call “probability distributions,” that match up with three states of ENSO: (i) Neutral (i.e., no El Niño or La Niña), (ii) La Niña, and (iii) El Niño. The red curve is significantly shifted to the right of the black/blue curves, showing that El Niño leads to increased chances of higher water levels in both Norfolk and San Francisco (indicated by the values on the horizontal x-axis). (4)
Wait, ENSO is located in the tropical Pacific. How does it impact the U.S. East Coast?
El Niño’s impact on sea level in San Francisco, CA, and the rest of the West Coast of the US is relatively direct. El Niño increases sea levels along the entire West Coast of North America, in part, due to how the Pacific Ocean adjusts to the large-scale changes in mass and temperature changes within the Tropics. Increases in temperature and water mass increase the sea level, and these effects migrate along the coasts of North and South America during an El Niño event. In contrast, El Niño’s effect on East Coast sea level is mostly due to wind patterns. During El Niño, the sea level along the East Coast is higher than average from about Cape Hatteras to Newfoundland and lower than average to the south of Cape Hatteras. As ENSO bloggers have noted previously, heating from the tropical Pacific leads to teleconnections (or “atmospheric bridges”) that ripple around the world. During El Niño, warmer-than-average sea surface temperatures in the eastern tropical Pacific produce a local shift in the rainfall patterns and an associated release of heat in the atmosphere several miles above the surface of the ocean. The shift in heating drives changes in the atmospheric circulation, which ultimately results in teleconnections throughout the globe, some influencing atmospheric circulation along the U.S. East coast. [Surface zonal wind anomalies (in meters per second) during the peak phase (December 1997-February 1998) of the 1997-98 El Niño. The zonal wind data is from the NCEP/NCAR reanalysis project [Kalney et al. (1996), The NCEP/NCAR 40-year reanalysis project. Bull. Am. Met. Soc., 77, 437-471.]. Image is from Ben Kirtman and was modified by NOAA Climate.]
During the El Niño in 1997-98 for instance, surface winds along the Northeast coast were more east-to-west (i.e., more on-shore) and along the Southeast coast they are more west-to-east (i.e., more off-shore). These changes in on-shore vs. off-shore winds are largely consistent with the coastal changes in sea level seen in the figure below. While the illustrations provided are just one case, many of these relationships hold during other El Niño events as well.
 [Sea surface height anomalies during the peak phase (December 1997-February 1998) of the 1997-98 El Niño. The sea surface height (in centimeters) is estimated from TOPEX-POSEIDON altimeter data. Image is from Ben Kirtman and was modified by NOAA climate.]
Developing an Early Warning System
To make progress on a coastal flooding early warning system for weeks to seasons in advance, we should see how well our current prediction systems (e.g., SubX and NMME coupled forecast models) capture coastal sea surface heights. Going forward, we hope to conduct these studies. The difficult challenge is then to relate the sea surface height forecasts to actual flood risk. This will require an additional level of concerted effort, and is something we intend to do. The notes above explain one possible way that experts could predict seasonal risk for high tide flooding in U.S. coastal communities: through direct prediction of coastal sea surface heights using one of NOAA’s forecasting systems, the NMME. Scientists at NOAA’s National Ocean Service have been exploring an alternative strategy: combining predictions of ENSO strength with a statistical model of high tide flooding observed at tide-gauge locations around the U.S. See their seasonal bulletins here.Footnotes:
(1) NOAA Technical Report NOS CO-OPS 086, “Patterns and Projections of High Tide Flooding Along the US Coastline Using a Common Impact Threshold” by Sweet, Dusek, Obeysekera and Marra. (2) The tides vary throughout the year largely driven by gravitational forces associated with the position of the Earth, Moon and Sun. The highest high tides typically occur in spring and fall and are often referred to as King tides. (3) Minor, moderate and major coastal flooding usually begins with 0.5 m, 0.8 m and 1.2 m above the multi-year average of the daily highest water levels. (4) It should be noted that tide gauge water levels and associated flooding are not entirely related to sea level in the open ocean or even near the coast, but sea level certainly is part of the puzzle. Edited for WeatherNation by Meteorologist Mace MichaelsAll Weather News
More