Will it Rain on Your Parade? A Look at Which Areas Typically See Fourth of July Storms
Special Stories
24 Jun 2019 11:35 PM
[Fireworks in Washington, D.C., on July Fourth, with the Washington Monument in the foreground. From iStock via NOAA]
[NOAA by Deke Arndt and Rebecca Lindsey] Independence Day isn't too far away, so here's a look at the historical probability that your Fourth of July picnic will be rained on, based on observations from 1981-2010.
If all we had to go on was history, this map says the best chances of clear skies in the contiguous United States (CONUS) would be found, not surprisingly, in the West. Based on past Fourths of July, chances for rain are 10 percent or less for a large area from interior Washington to northwest New Mexico. In the CONUS, the highest chances for rain on your parade would be in southern Florida (40-50%), followed by the highest elevations of the Appalachian Mountains in North Carolina and West Virginia, and the Northeastern border with Canada, where chances of rain on July 4th have been 30-40 percent. These places reflect locations with, historically, the combination of abundant available moist air and ways to lift that moist air, in the form of mountains or strong daytime heating.
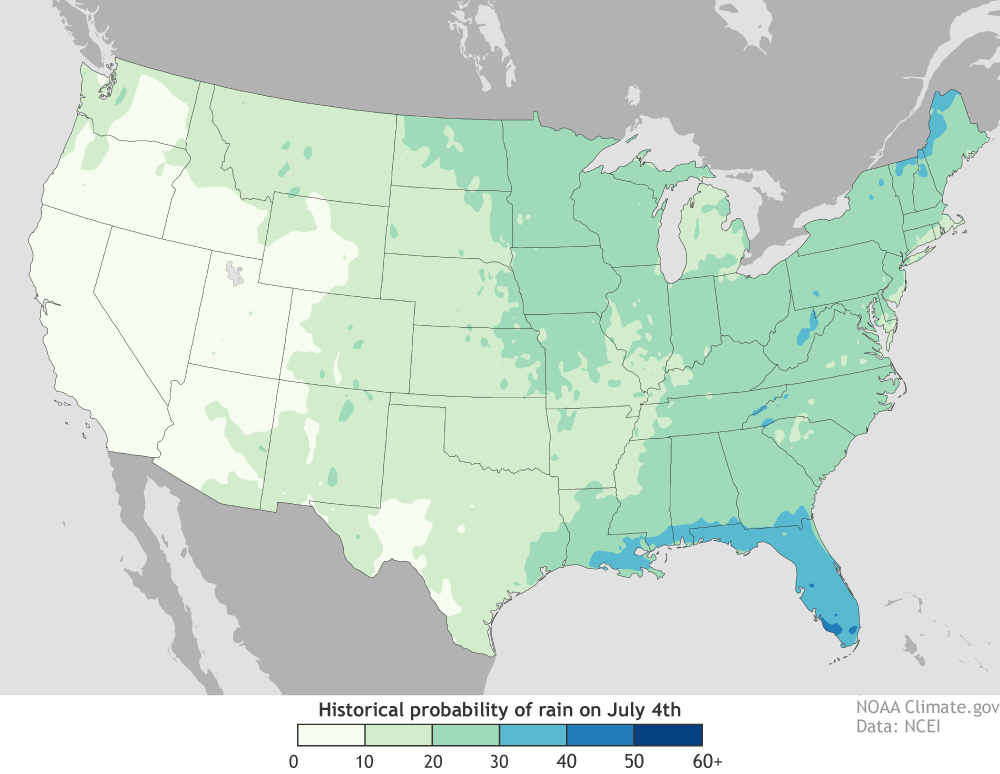 [Percent chance of at least 0.1 inch of rain on the Fourth of July, based on past weather. Double click to zoom, then single click for individual station info. Click and hold to drag. NOAA Climate map, based on U.S. Climate Normals data for 1981-2010, provided by Deke Arndt, National Centers for Environmental Information.]
But the highest probability of rain on Fourth of July for any U.S. state is in Hawaii, where the eastern slopes have a 50 percent chance or more of precipitation that day. On the lee side of the islands, however, the chances for rain drop to 10 percent or less.
[Percent chance of at least 0.1 inch of rain on the Fourth of July, based on past weather. Double click to zoom, then single click for individual station info. Click and hold to drag. NOAA Climate map, based on U.S. Climate Normals data for 1981-2010, provided by Deke Arndt, National Centers for Environmental Information.]
But the highest probability of rain on Fourth of July for any U.S. state is in Hawaii, where the eastern slopes have a 50 percent chance or more of precipitation that day. On the lee side of the islands, however, the chances for rain drop to 10 percent or less.
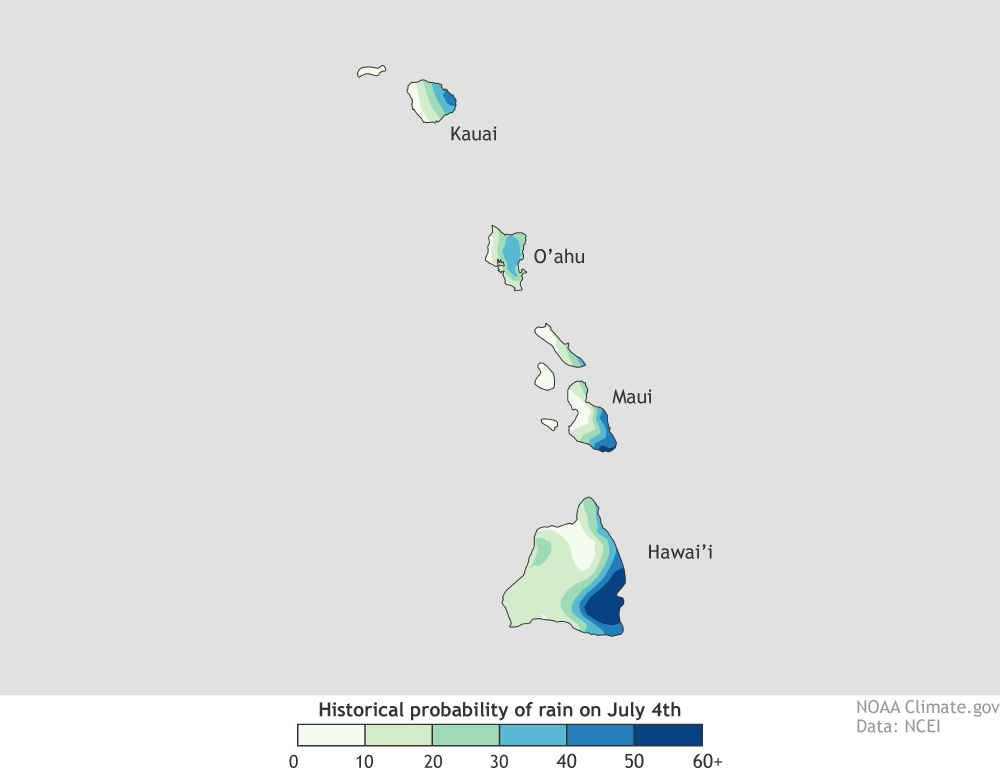 [Percent chance of at least 0.1 inch of rain on the Fourth of July, based on past weather in Hawaii. The probability of rain increases from west to east, with the lowest chances for rain on the rain-shadowed western slopes and the highest chances on the northeastern slopes, which face the prevailing winds. NOAA Climate map, based on U.S. Climate Normals data for 1981-2010, provided by Deke Arndt, National Centers for Environmental Information.]
Alaska has also historically had a wide spread in the chance of rain on July 4th, with chances on the North Slope of 10 percent or less and chances in coastal, Southeast Alaska of between 30-40 percent.
[Percent chance of at least 0.1 inch of rain on the Fourth of July, based on past weather in Hawaii. The probability of rain increases from west to east, with the lowest chances for rain on the rain-shadowed western slopes and the highest chances on the northeastern slopes, which face the prevailing winds. NOAA Climate map, based on U.S. Climate Normals data for 1981-2010, provided by Deke Arndt, National Centers for Environmental Information.]
Alaska has also historically had a wide spread in the chance of rain on July 4th, with chances on the North Slope of 10 percent or less and chances in coastal, Southeast Alaska of between 30-40 percent.
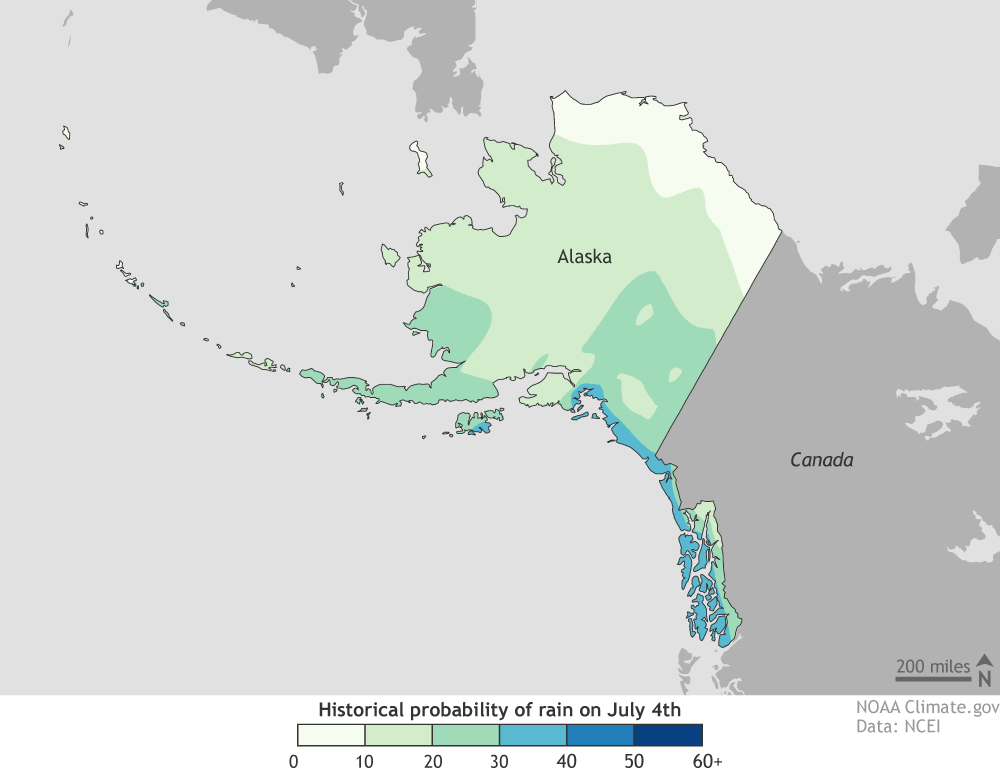 [Percent chance of at least 0.1 inch of rain on the Fourth of July, based on past weather in Alaska. The probability of rain increases from north to south, with the lowest chances for rain across the North Slope, and the highest chances in the coastal Southeast. NOAA Climate map, based on U.S. Climate Normals data for 1981-2010, provided by Deke Arndt, National Centers for Environmental Information.]
 [Fireworks in St. Louis. Photo from iStock via NOAA]
[Percent chance of at least 0.1 inch of rain on the Fourth of July, based on past weather. Double click to zoom, then single click for individual station info. Click and hold to drag. NOAA Climate map, based on U.S. Climate Normals data for 1981-2010, provided by Deke Arndt, National Centers for Environmental Information.]
But the highest probability of rain on Fourth of July for any U.S. state is in Hawaii, where the eastern slopes have a 50 percent chance or more of precipitation that day. On the lee side of the islands, however, the chances for rain drop to 10 percent or less.
[Percent chance of at least 0.1 inch of rain on the Fourth of July, based on past weather in Hawaii. The probability of rain increases from west to east, with the lowest chances for rain on the rain-shadowed western slopes and the highest chances on the northeastern slopes, which face the prevailing winds. NOAA Climate map, based on U.S. Climate Normals data for 1981-2010, provided by Deke Arndt, National Centers for Environmental Information.]
Alaska has also historically had a wide spread in the chance of rain on July 4th, with chances on the North Slope of 10 percent or less and chances in coastal, Southeast Alaska of between 30-40 percent.
[Percent chance of at least 0.1 inch of rain on the Fourth of July, based on past weather in Alaska. The probability of rain increases from north to south, with the lowest chances for rain across the North Slope, and the highest chances in the coastal Southeast. NOAA Climate map, based on U.S. Climate Normals data for 1981-2010, provided by Deke Arndt, National Centers for Environmental Information.]
How does NOAA come up with these maps?
These kinds of historical-chances maps—the historical chance of a white Christmas; the chance of a Pennsylvania rodent seeing his shadow, and so on—are based on the nation’s “normals.” Normals are calculated every ten years at NOAA’s National Centers for Environmental Information. These are the same normals that your weather forecaster is talking about when she or he says “today was 4 degrees above normal.”How much rain are we considering here?
These maps are based on the historical likelihood that at least one-tenth inch of rain will occur. Why one-tenth inch? Because that’s plenty to drench your crepe paper float, make your hot dog buns soggy, or drown out your fireworks. If you’re interested, there are also chances calculated for a hundredth of an inch, a half-inch or an inch.
[Fireworks in St. Louis. Photo from iStock via NOAA]
Which should I use: normals or forecasts?
If you’re planning for an event that’s within 7-10 days, always use the forecast! Later this week, you will start to see the 4th of July in your local forecasts. Forecasters track patterns that will move the chance of precipitation for a specific, upcoming day up or down from the historical norm. However, if you’re planning for next year’s July 4th, or any event beyond a dozen or so days, normals are a great way to gauge things.So, are we only considering July 4th here?
Actually, no. Climatologically speaking, July 4th isn’t all that different from July 3rd, or 6th, or even June 30th, for that matter. These normals capture a range of dates surrounding July 4th to help broaden the sample for a specific date. This has the effect of smoothing out some of the “noise” that would be associated with only focusing on a single, specific date. For WeatherNation: Meteorologist Mace MichaelsAll Weather News
More
Severe Weather: Energy From the Midwest Now in the Southeast
UPPER MIDWEST - Through Monday, dangerous tor
29 Jul 2026 2:25 PM


Flooding Risk Increases as Heavy Rain Targets the Tri-State Area
Tuesday, heavy rainfall moved across the nort
29 Jul 2026 2:00 PM

Tropics: Fausto Heads towards Hawaii; Genevieve a Major Hurricane
PacificTropical Depression Fausto continues t
29 Jul 2026 10:15 AM


Southeast Flood Risk Lingers Near Stalled Front
A stalled boundary over the Southeast will ke
25 Jul 2026 10:55 AM

Another Round of Storms Targets the Northeast
Tuesday brought severe weather again across p
23 Jul 2026 1:15 AM