Could This be a Record 'Atmospheric River?'

Special Stories
4 Apr 2018 9:49 PM
All eyes are on the upcoming atmospheric river event coming into California Thursday and Friday. But to put the storm in perspective, could this event carry record amounts of moisture? To answer that question (possibly) we head on over to Oakland, California.
Related story: What are atmospheric rivers?
The forecast, as of Wednesday evening, for Oakland's rainfall is 2 to 3 inches. For the entire month of April the city averages around 1.5 inches of precipitation. So right off the bat we know that a lot of moisture is coming. But how do we measure moisture?
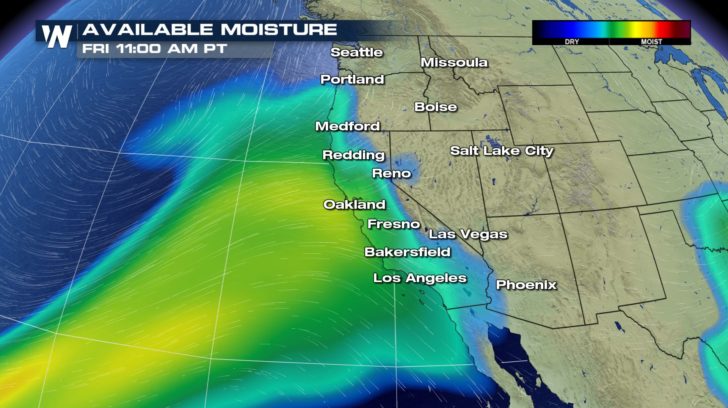 The forecast Precipitable Water valid Friday, April 6 where greens and yellows show the higher amounts of 'Pwat.'
We now turn to the precipitable water value in meteorology. Often abbreviated Pwat, the value measures the amount of water in a column of air. Simply, the higher the value the more moist the air mass is. It's an excellent forecasting tool for the chances of rain, precipitation amounts, and overall pattern changes. Here, you can see the solid colors of greens and yellows streaming in from the Pacific Ocean and into California on Friday.
The forecast Precipitable Water valid Friday, April 6 where greens and yellows show the higher amounts of 'Pwat.'
We now turn to the precipitable water value in meteorology. Often abbreviated Pwat, the value measures the amount of water in a column of air. Simply, the higher the value the more moist the air mass is. It's an excellent forecasting tool for the chances of rain, precipitation amounts, and overall pattern changes. Here, you can see the solid colors of greens and yellows streaming in from the Pacific Ocean and into California on Friday.
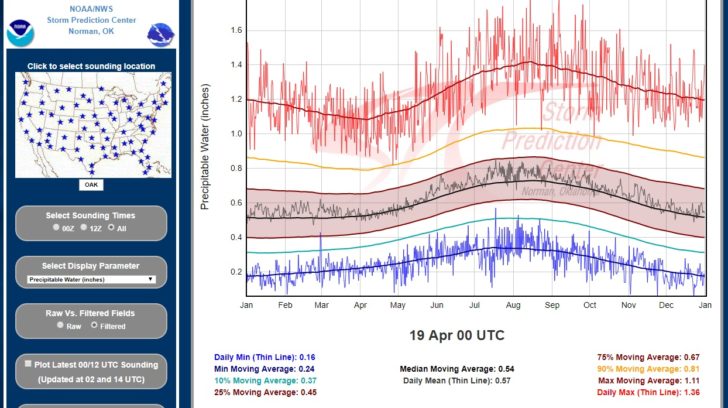 Maximums, minimums, and averages for Precipitable Water in Oakland, CA throughout the year. Courtesy NOAA/SPC
The graph above may be a bit complicated so let's take you through it piece, by piece. This is a graph of the annual variation in precipitable water for Oakland, California. January begins on the far left, going to the end of December on the far right. The top red line is the maximum daily Pwat observed for that specific day. The middle shaded area is your most common 'average' Pwat level for the date. Blue is a minimum for the date. The Pwats are collected via weather balloon launches that happen at least twice a day.
Related story: Balloons on a mission
The data above is being pulled by all of the weather balloon launches for Oakland, California, roughly 47,000 of them. That equates to about 60-65 years of data from the area. An average Pwat for Oakland in April is around 0.55 inches. The highest April Pwat observed (according to the chart above) was 1.36." The upcoming atmospheric river has a shot at beating that record.
Maximums, minimums, and averages for Precipitable Water in Oakland, CA throughout the year. Courtesy NOAA/SPC
The graph above may be a bit complicated so let's take you through it piece, by piece. This is a graph of the annual variation in precipitable water for Oakland, California. January begins on the far left, going to the end of December on the far right. The top red line is the maximum daily Pwat observed for that specific day. The middle shaded area is your most common 'average' Pwat level for the date. Blue is a minimum for the date. The Pwats are collected via weather balloon launches that happen at least twice a day.
Related story: Balloons on a mission
The data above is being pulled by all of the weather balloon launches for Oakland, California, roughly 47,000 of them. That equates to about 60-65 years of data from the area. An average Pwat for Oakland in April is around 0.55 inches. The highest April Pwat observed (according to the chart above) was 1.36." The upcoming atmospheric river has a shot at beating that record.
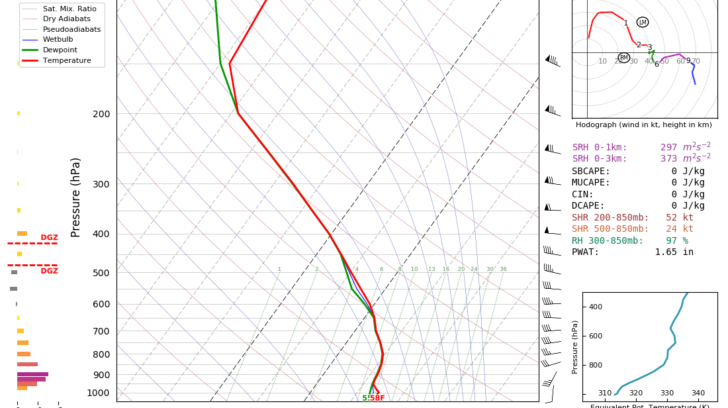 Forecast sounding for Oakland, California on Friday, April 6. Courtesy tropicaltidbits.com
When weather balloons are launched they collect data for something called a 'sounding.' A sounding is the two-dimensional view of the atmosphere from the surface (bottom of the image) to the top of the troposphere (top of the image). Forecast soundings are predictions of what the atmosphere will look like in this two-dimensional view. Pictured above is Oakland on Friday the 6th. Big thanks to tropicaltidbits.com for the image. This image shows a completely saturated atmosphere, where the green and red lines are together from top to bottom. Red indicates temperature and green indicates dew point temperature. On a clear night when the temperature reaches the dew point, dew forms on your lawn...aka saturation happens. The raw data for Oakland sits on the right side of the image. On the bottom it shows the Pwat number to be 1.65. That means the forecast is for a precipitable water value of 1.65 inches on Friday, April 6th! Once again for comparison, an average Pwat is around 0.55" (forecast to be 3 times as high) and the highest April number is 1.36!
Long story short, heavy rain will pour into California for the end of the week. Flooding will be the biggest concern in many areas. We have written extensively about the potential hazards here. Please share with those in the area!
For WeatherNation, Meteorologist Steve Glazier
Forecast sounding for Oakland, California on Friday, April 6. Courtesy tropicaltidbits.com
When weather balloons are launched they collect data for something called a 'sounding.' A sounding is the two-dimensional view of the atmosphere from the surface (bottom of the image) to the top of the troposphere (top of the image). Forecast soundings are predictions of what the atmosphere will look like in this two-dimensional view. Pictured above is Oakland on Friday the 6th. Big thanks to tropicaltidbits.com for the image. This image shows a completely saturated atmosphere, where the green and red lines are together from top to bottom. Red indicates temperature and green indicates dew point temperature. On a clear night when the temperature reaches the dew point, dew forms on your lawn...aka saturation happens. The raw data for Oakland sits on the right side of the image. On the bottom it shows the Pwat number to be 1.65. That means the forecast is for a precipitable water value of 1.65 inches on Friday, April 6th! Once again for comparison, an average Pwat is around 0.55" (forecast to be 3 times as high) and the highest April number is 1.36!
Long story short, heavy rain will pour into California for the end of the week. Flooding will be the biggest concern in many areas. We have written extensively about the potential hazards here. Please share with those in the area!
For WeatherNation, Meteorologist Steve Glazier
The forecast Precipitable Water valid Friday, April 6 where greens and yellows show the higher amounts of 'Pwat.'
We now turn to the precipitable water value in meteorology. Often abbreviated Pwat, the value measures the amount of water in a column of air. Simply, the higher the value the more moist the air mass is. It's an excellent forecasting tool for the chances of rain, precipitation amounts, and overall pattern changes. Here, you can see the solid colors of greens and yellows streaming in from the Pacific Ocean and into California on Friday.
Maximums, minimums, and averages for Precipitable Water in Oakland, CA throughout the year. Courtesy NOAA/SPC
The graph above may be a bit complicated so let's take you through it piece, by piece. This is a graph of the annual variation in precipitable water for Oakland, California. January begins on the far left, going to the end of December on the far right. The top red line is the maximum daily Pwat observed for that specific day. The middle shaded area is your most common 'average' Pwat level for the date. Blue is a minimum for the date. The Pwats are collected via weather balloon launches that happen at least twice a day.
Related story: Balloons on a mission
The data above is being pulled by all of the weather balloon launches for Oakland, California, roughly 47,000 of them. That equates to about 60-65 years of data from the area. An average Pwat for Oakland in April is around 0.55 inches. The highest April Pwat observed (according to the chart above) was 1.36." The upcoming atmospheric river has a shot at beating that record.
Forecast sounding for Oakland, California on Friday, April 6. Courtesy tropicaltidbits.com
When weather balloons are launched they collect data for something called a 'sounding.' A sounding is the two-dimensional view of the atmosphere from the surface (bottom of the image) to the top of the troposphere (top of the image). Forecast soundings are predictions of what the atmosphere will look like in this two-dimensional view. Pictured above is Oakland on Friday the 6th. Big thanks to tropicaltidbits.com for the image. This image shows a completely saturated atmosphere, where the green and red lines are together from top to bottom. Red indicates temperature and green indicates dew point temperature. On a clear night when the temperature reaches the dew point, dew forms on your lawn...aka saturation happens. The raw data for Oakland sits on the right side of the image. On the bottom it shows the Pwat number to be 1.65. That means the forecast is for a precipitable water value of 1.65 inches on Friday, April 6th! Once again for comparison, an average Pwat is around 0.55" (forecast to be 3 times as high) and the highest April number is 1.36!
Long story short, heavy rain will pour into California for the end of the week. Flooding will be the biggest concern in many areas. We have written extensively about the potential hazards here. Please share with those in the area!
For WeatherNation, Meteorologist Steve GlazierAll Weather News
More
Southeast Flood Risk Lingers Near Stalled Front
A stalled boundary over the Carolinas will ke
24 Jul 2026 12:35 PM

Severe Chances Return for the Midwest
The upcoming stretch of hot temperatures will
24 Jul 2026 12:25 PM

Tropics: Fausto Heads to Hawaii, Bertha Breaks Apart
BerthaBertha has dissipated after moving inla
24 Jul 2026 11:50 AM

Hot & Smoky w/ a Chance of Lightning
Conditions have been really dry out west. We'
24 Jul 2026 11:15 AM

Very Hot Temperatures For the Western and Central United States
Are you over the summer heat yet? Well, more
24 Jul 2026 9:20 AM

Another Round of Storms Targets the Northeast
Tuesday brought severe weather again across p
23 Jul 2026 1:15 AM

Another Round of Severe Weather for the Upper Midwest and Great Lakes
The upper-level low train continues to keep t
21 Jul 2026 1:45 AM